In the previous lesson dedicated to Japanese candlesticks, we looked at the reversal candlestick patterns. This type of pattern signals a possible change in a trend. Contrary to them, there is another group of patterns confirming the strength of the trend. They are called continuation candlestick patterns.
Continuation candlestick patterns – a group of candlestick patterns that indicates that a trend will resume.
"I noticed one continuation candlestick pattern on a chart, but the trend suddenly turned in the opposite direction. Why did that happen?"
You need to keep in mind that after a continuation pattern, there can be a correction. Still, as you know, after the rain there will be sun. This, if you see a continuation candlestick pattern and a trend starts correcting, there is an 80% chance that the price will come back moving within a trend.
Overall, continuation patterns allow you to take a deep breath before the further rally. Let’s look at the most popular continuation candlestick patterns you need to be familiar with.
Continuation of an uptrend
Which forms of candlestick patterns do you need to see to confirm the strength of an uptrend? Let's find out!
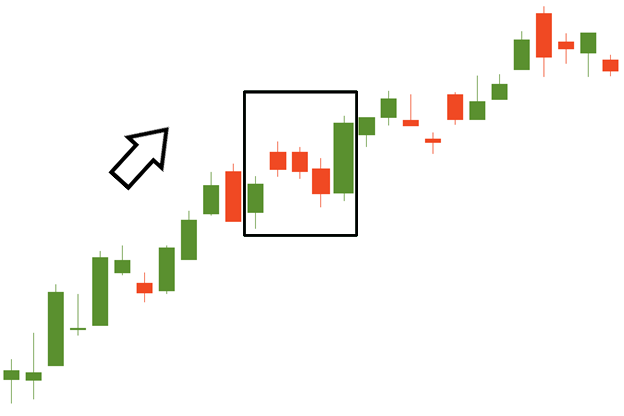
Rising Window
Main characteristics:
1. The number of candlesticks: 2;
2. Frequency: High;
3. Color: The signal is stronger if both candlesticks are bullish;
4. Key features: the first candle is in an uptrend or closes above the trendline, and the low of the second candle is above the first candle’s high.
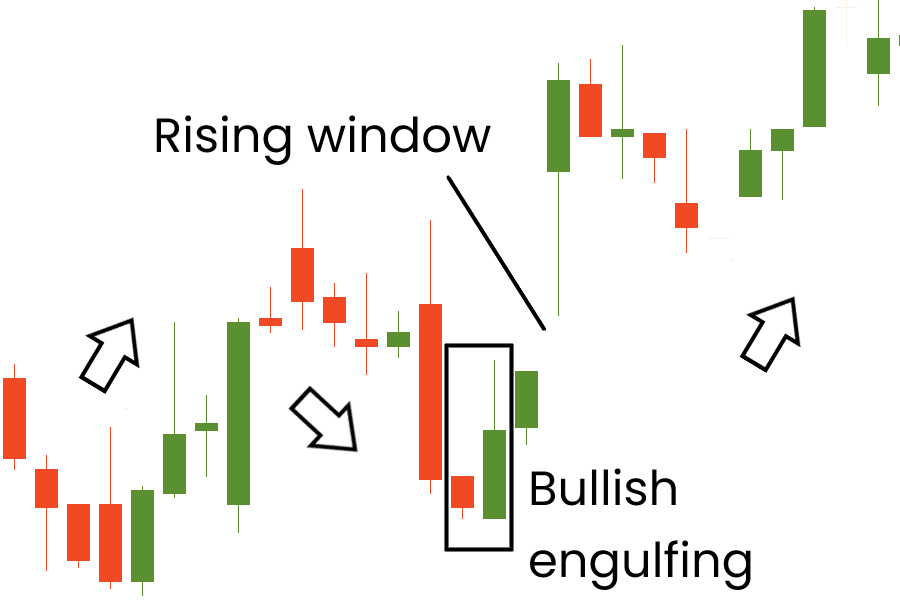
The pattern may resemble a “gap up” situation with some exceptions. First of all, it should appear during the uptrend. Secondly, the first candlestick’s closing price should appear above the trend line. Finally, the second candlestick should open above the first candlestick’s closing price.
Here are three more interesting insights about this pattern:
According to researchers, if the second candlestick in this pattern is bearish or doji, the signal is weaker;
Steve Nison claims that a signal of this pattern is stronger if it appears after the bullish reversal pattern;
If the “rising window” appears three times, there are high chances of a trend reversal.
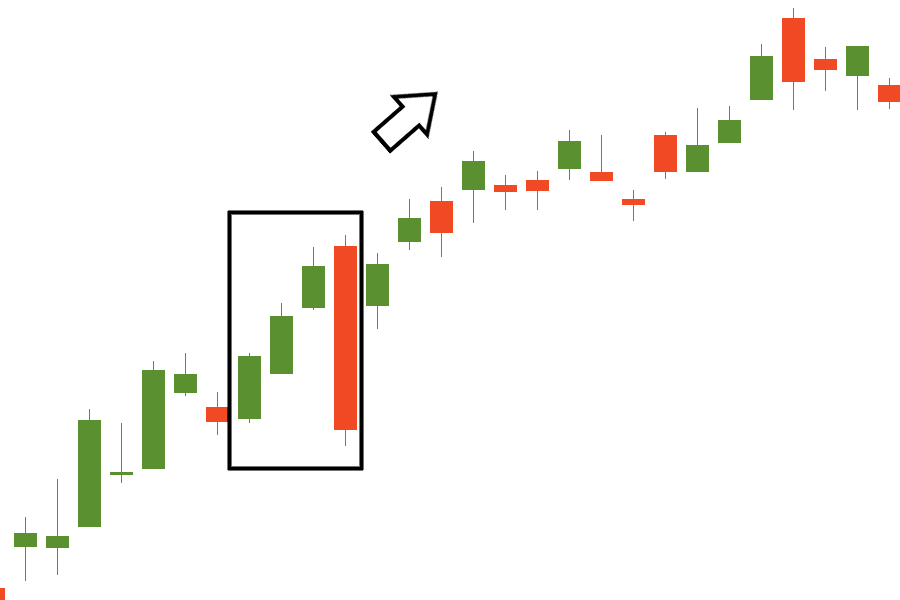
Upside Tasuki Gap
Main characteristics:
1. The number of candlesticks: 3;
2. Frequency: Low;
3. Color: The first and the second candlesticks are bullish, and the third is bearish;
4. Key features: The first candle is in an uptrend or closes above the trendline, the low of the second candle is above the first candle’s high, and the third should open within the prior body and close above the first candle’s closing. Sounds complicated? Look at the picture below!
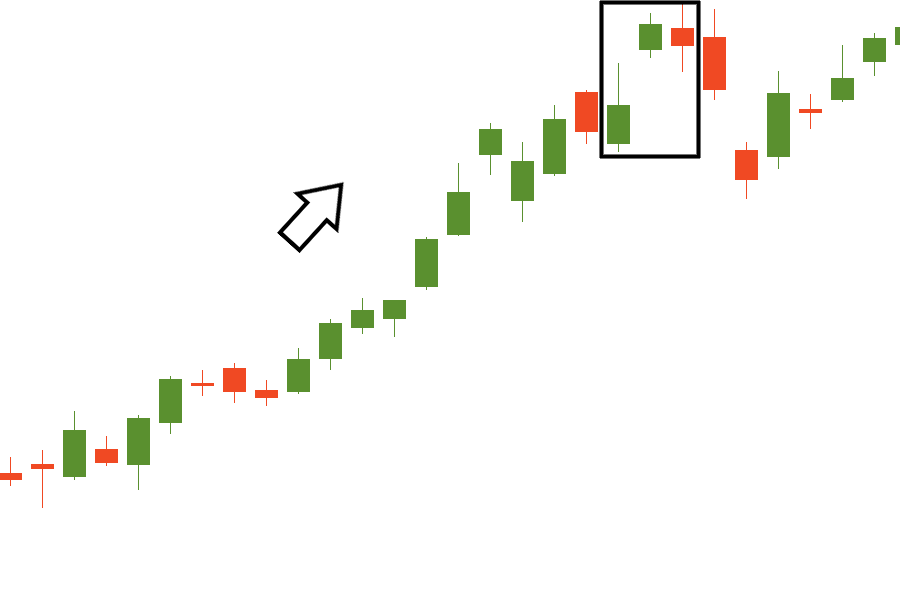
If you like to trade gaps, you need to remember this pattern. After a candlestick in an uptrend, the next candle opens with a gap. Then the third candle opens lower and closes lower than the previous one. Keep in mind that the reliability of this pattern is higher if the gap is not filled in the upcoming periods.
"Is it really necessary to memorize this pattern?"
According to Steve Nison, the most important part of this pattern is a gap (a window). If it appears on the chart, it will act as a support. The trend will likely reverse if the next candles close below this gap (below the support).
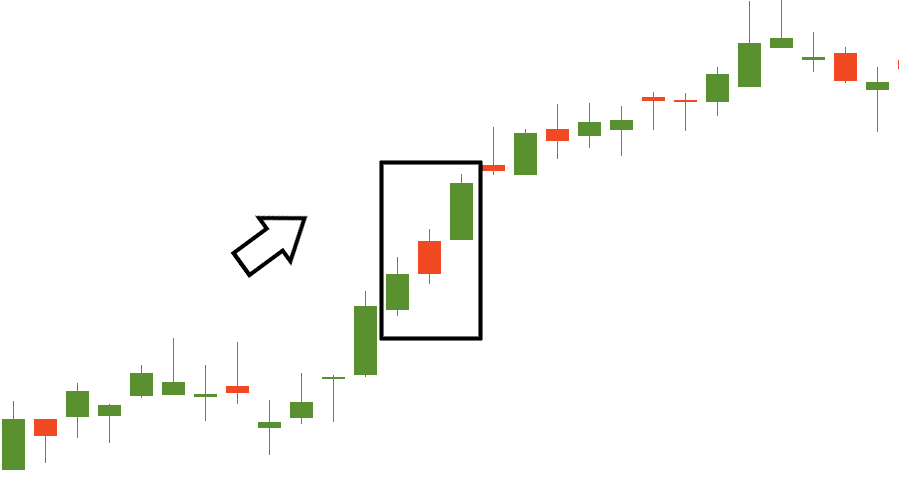
Upside Gap Three Methods
Main characteristics:
1. The number of candlesticks: 3;
2. Frequency: Low;
3. Color: The first and the second candlesticks are bullish, and the third candlestick is bearish;
4. Key features: The situation is similar to the Tasuki Gap pattern. The main difference is that the final day should open within the body of the top bullish candlestick and close within the body of the lower candlestick.
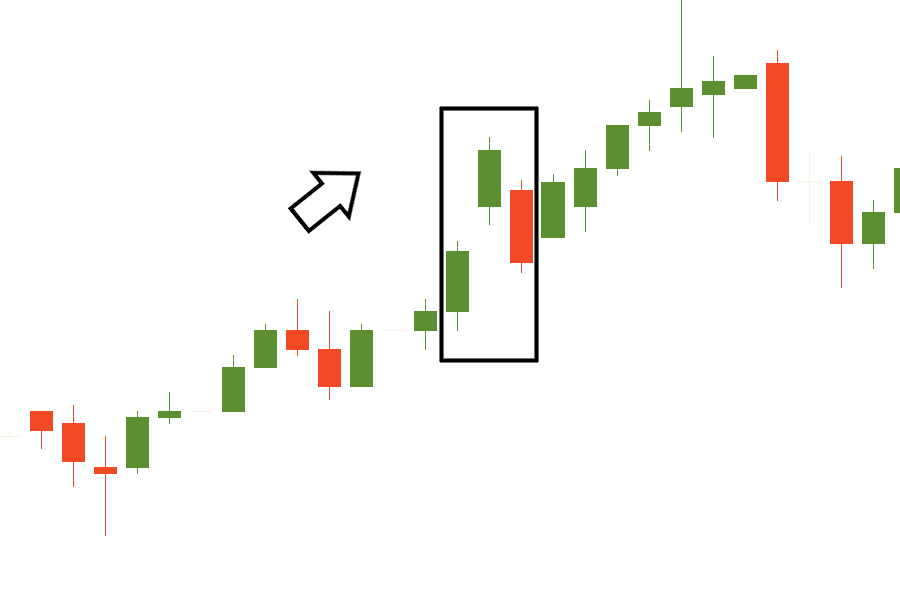
What is so special about the Upside Gap Three Methods? How is it different from the Upside Tasuki Gap? In the case of this pattern, the gap is needed to be filled. This pattern requires confirmation. This can be a big bullish candlestick closing above the third candlestick's open price.
Rising Three Methods
Main characteristics:
1. The number of candlesticks: 4-7;
2. Frequency: Medium;
3. Color: The first candle is bullish, the next 2-5 candles are bearish, and the big bullish candle confirms the pattern;
4. Key features: After a big bullish candle in an uptrend, a series of small bearish ones show the trend’s pullback. The big bullish candle after a correction confirms the trend’s continuation.
Any trend faces a time of correction when investors fix their profits. This is what this pattern represents. After a big bullish spike, there are small bearish candlesticks. The optimal number of these pullback candles should be 3, though 2, 4, or 5 correction candles can also be observed. These bearish candlesticks mustn’t close below the opening level of the first big bullish candle.
Here are three more interesting insights about this pattern:
The shadows of the bearish candles shouldn’t go below the bullish candle’s open;
The final candle of the formation should open up in the body of the last bearish pullback candle and close above the first big bullish candlestick;
It looks just like the “Flag” chart pattern! Moreover, their signals are the same.
Mat hold
Main characteristics:
1. The number of candlesticks: 4-7;
2. Frequency: Medium;
3. Color: The first candle is bullish, the next 2-5 candles are bearish, and the big bullish candle confirms the pattern;
4. Key features: Similar to the Rising Three Methods, but there is a gap up followed by a series of small candles. These candles remain close to the top of the first bullish candle’s range. The second or the third one of them dips into the body of the large bullish candlestick. A large bullish candle confirms the pattern.
What are the main differences between this pattern and the Rising Three Methods? Firstly, there is a gap up after the first bullish candlestick. Secondly, the second and third candles should be located close to the top of the first candle. Finally, this pattern provides a stronger signal than the previous one.
Three Line Strike
Main characteristics:
1. The number of candlesticks: 3;
2. Frequency: Low;
3. Color: Three bullish candlesticks and the fourth candlestick is bearish;
4. Key features: After the three strong bullish candles that close progressively higher, the fourth one opens above them but then closes below the opening of the first candlestick.
This candlestick pattern may be very tricky. A novice trader may be scared by the big bearish candlestick after the bullish one and close their trade. However, if you know this pattern, you can be sure that such a situation demonstrates that the strike candle is a temporary correction and that after it, the trend will resume in the direction of the first three candles. Just be sure that bullish candles are at least of average size.
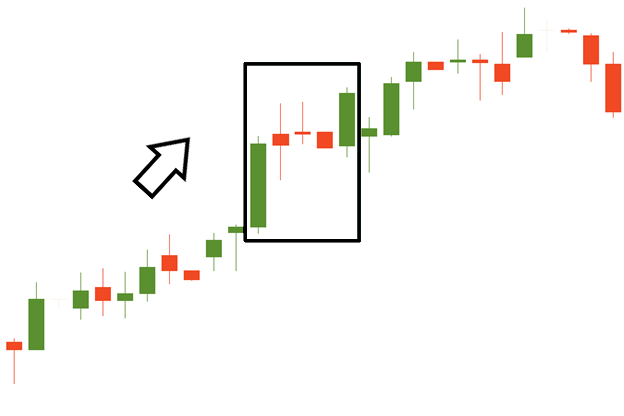
Separating Lines
Main characteristics:
1. The number of candlesticks: 3;
2. Frequency: Low;
3. Color: The first and the third candlesticks are bullish, and the second candlestick is bearish;
4. Key features: The pattern appears in an uptrend. After a long bullish candle, a bearish candle opens with a gap but closes when the high of the bullish candle is reached. The next one is bullish, which opened at the same level as the bearish candle. On smaller timeframes, you can notice a gap. The second candle doesn’t have a lower wick.
The name of this pattern is not a coincidence! The three candlesticks move in different directions. This way, they are separated from each other. The pattern means that although sellers could seize control of the market, it was only for a short period, and buyers became even stronger. Be careful with three moments here, they are:
The third bullish candle and the second bearish one need to share the opening price;
The third bullish candle doesn’t have a lower wick;
The longer the candles in the bullish “Separating lines” pattern are, the more reliable this pattern is.
Above, we considered the main continuation candlestick patterns that appear during an uptrend. In the next part of this lesson, we’ll look at the patterns that signal the strength of a downtrend.
Continuation of a downtrend
Most of the continuation candlestick patterns we will describe are the same as in the uptrend. Let's have a look at them in detail.
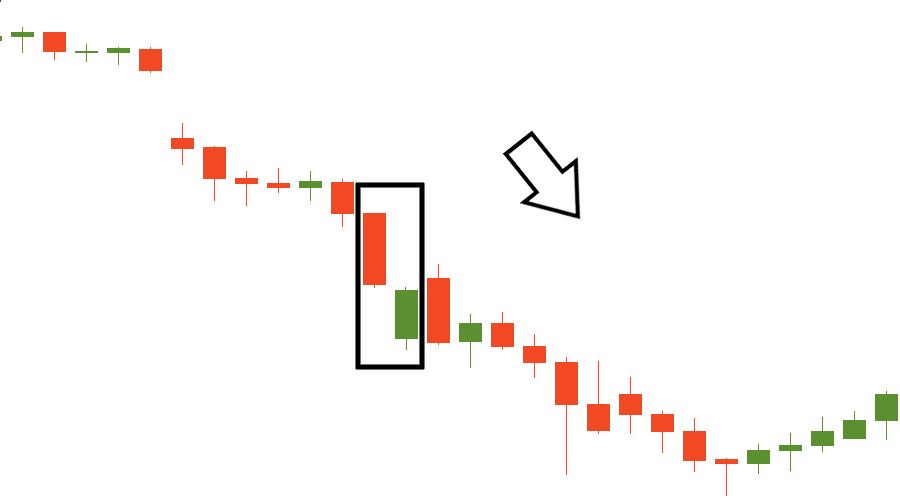
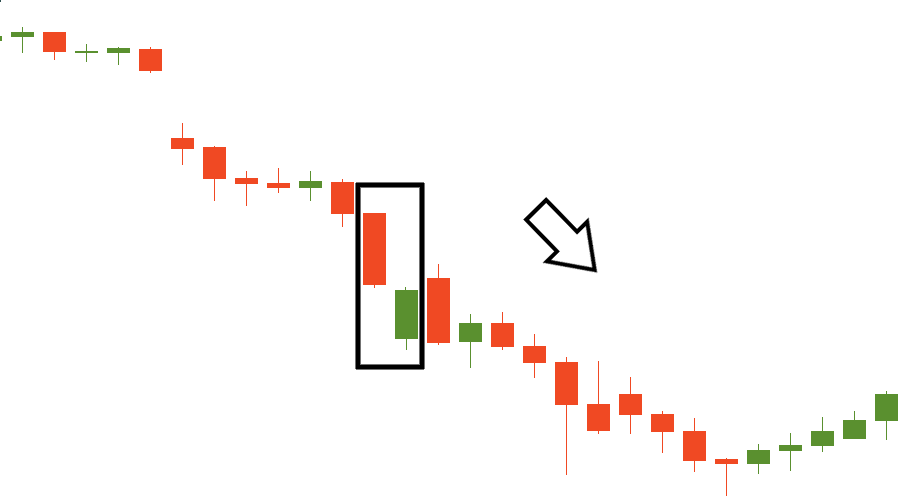
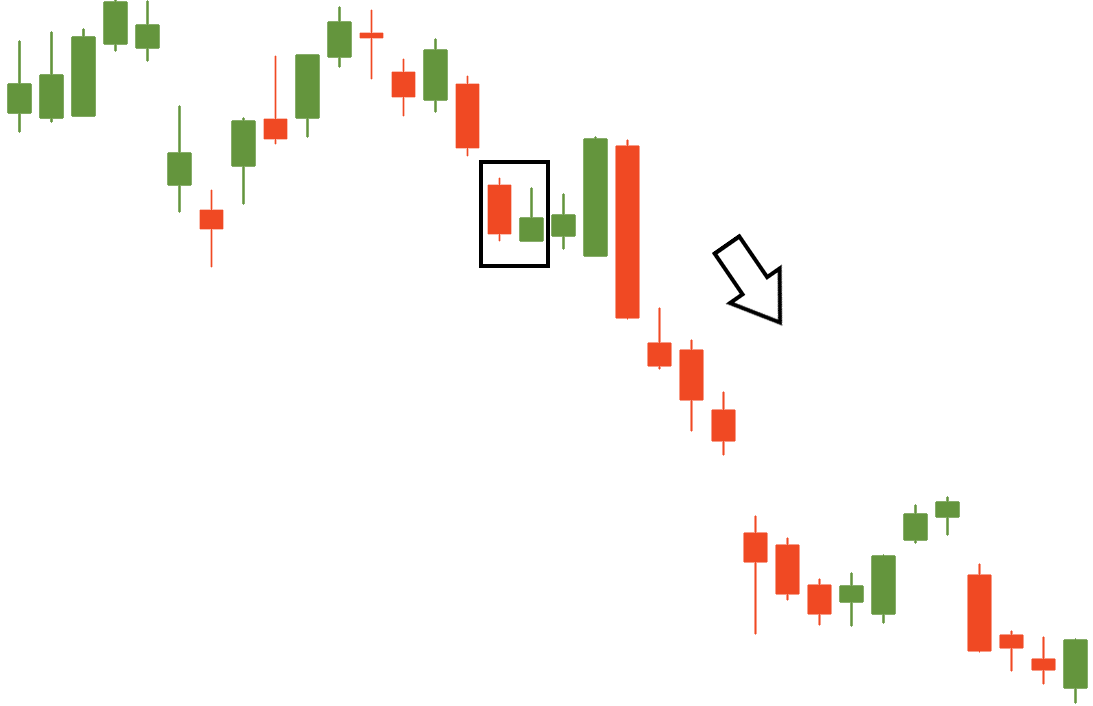
Falling Window
Main characteristics:
1. The number of candlesticks: 1;
2. Frequency: High;
3. Color: Bearish;
4. Key features: The first candle is bearish, and the second one appears after the gap. The candle’s high is below the previous candle’s low.
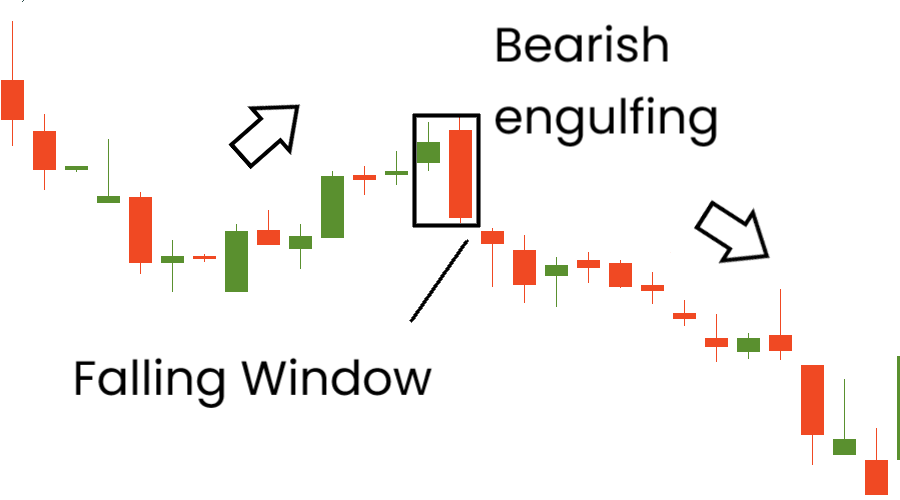
This pattern represents a gap down. The reliability of this pattern increases if it appears after the bearish reversal patterns (see the example above). The pattern is confirmed if the next candlestick after the pattern is bearish. Be extremely careful with trading this pattern, as a gap may be a part of the bullish reversal pattern.
Downside Tasuki Gap
Main characteristics:
1. The number of candlesticks: 3;
2. Frequency: Low;
3. Color: The first and the second candlesticks are bearish, and the third candlestick is bullish;
4. Key features: A gap is down after the first candle is in a downtrend. The second candle is bearish. The third candle should open higher and close higher than the previous one.
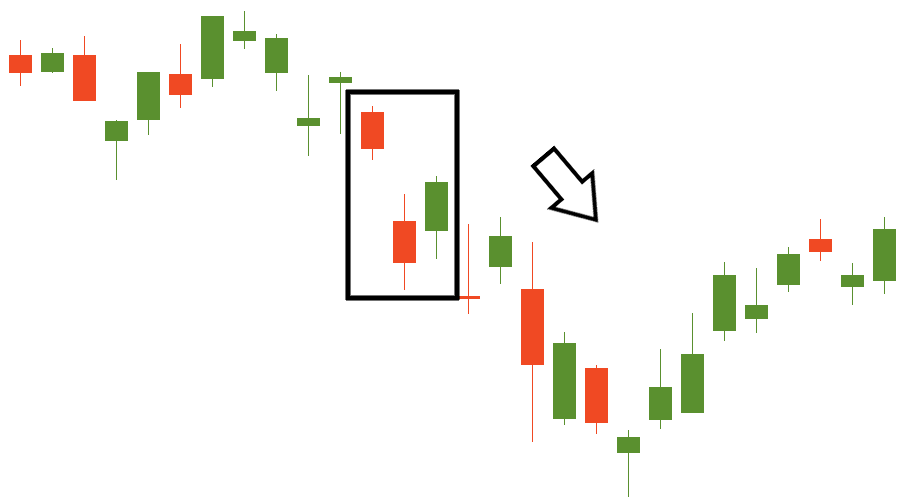
The main part of this pattern is a gap down. After it, a bearish candlestick should be formed. The third candlestick should open higher than the closing price of the second candlestick and close above the second candlestick.
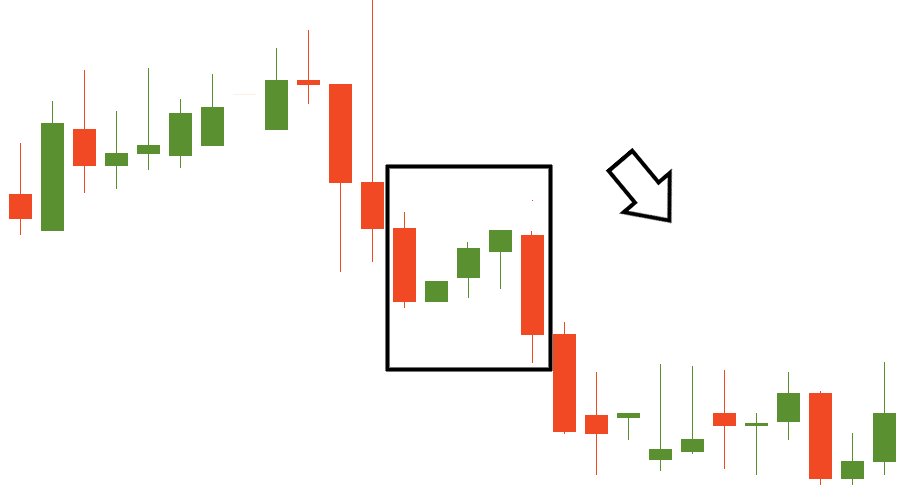
Downside Gap Three Methods
Main characteristics:
1. The number of candlesticks: 3;
2. Frequency: Low;
3. Color: The first and the second candlesticks are bearish, and the third candlestick is bullish;
4. Key features: A gap is down after the first candle is in a downtrend. The second candle is bearish. The next candle opens within the body of the second candlestick, fills the gap, and closes within the body of the first candlestick.
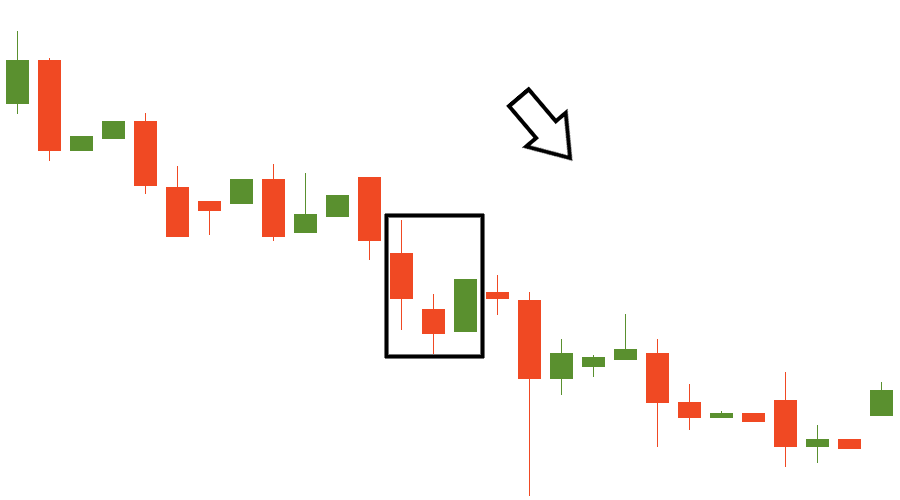
"It looks like the reversal morning star pattern!"
Pay attention to the fact that the third candlestick closes within the first candle's body; the lower the close, the more likely it’s the bearish continuation pattern. This pattern may be a trap for a newbie who studies candlestick patterns. The confusion may come with a filled gap. Even though the gap is closed, bears remain in control. Therefore, the pattern should be confirmed with the price moving below the second candlestick.
On Neck
Main characteristics:
1. The number of candlesticks: 2;
2. Frequency: Medium;
3. Color: The first candle is bearish, and the second candle is bullish;
4. Key features: The first long candle opens with a gap down, and the second reaches the previous candle's low.
The next candlesticks are for true candlestick fans! They are not so easy to see, so it’s kind of a challenge to notice them to an unprepared eye. The first bearish candle opens with a gap down and has a long body. The second candle is bullish and reaches only the low of the previous day, not its close level.
The pattern means that although bulls tried to seize power, they failed to push the price high enough, so the downtrend continues after the brief bullish correction.
In Neck
Main characteristics:
1. The number of candlesticks: 2;
2. Frequency: Medium;
3. Color: The first candle is bearish, and the second candle is bullish;
4. Key features: The first long candle opens with a gap down, and the second closes at the close price of the first candlestick or slightly higher.
This pattern is similar to the "On Neck" pattern, but the second candlestick closes at the close of the first candlestick or within its body. The "In neck" pattern indicates that there was some short-covering, but the trend direction didn’t change and remained bearish.
Thrusting
Main characteristics:
1. The number of candlesticks: 2;
2. Frequency: Medium;
3. Color: The first candle is bearish, and the second candle is bullish;
4. Key features: The first long candle opens with a gap down, and the second closes near but slightly below the midpoint of the first candle’s body.
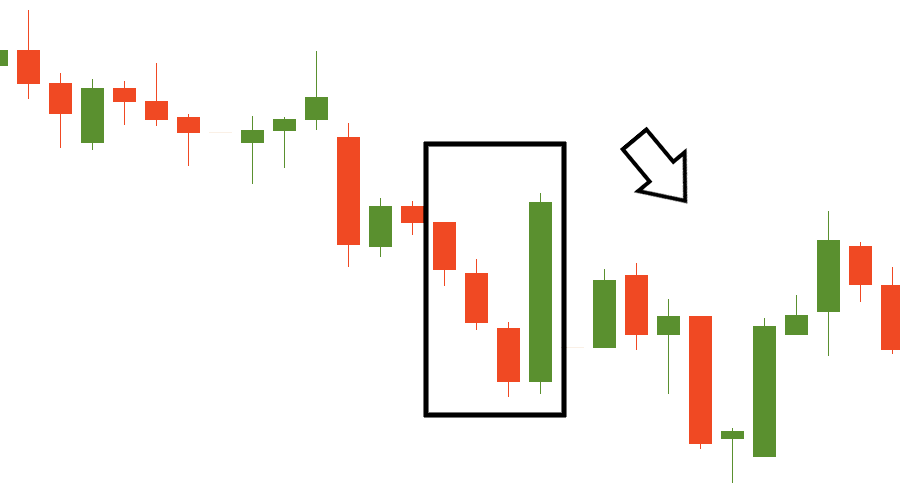
Falling Three Methods
Main characteristics:
1. The number of candlesticks: 4-7;
2. Frequency: Medium;
3. Color: The first candle is bearish, the next 2-5 candles are bullish, and the final candle of the pattern is bearish;
4. Key features: The first candlestick is long; after it, there is a series of 2-5 bullish ones. The next candlestick opens in the body of the last bullish candle and closes below the first bearish candle’s close.
Contrary to the Rising Three Methods pattern, this indicates the continuation of the downtrend. After the long bearish candlestick, there are 2-5 small bullish ones. The pattern is confirmed when the big bearish candlestick appears on the chart, opens in the body of the last bullish candle, and closes below the first big bearish candle's close.
Bearish Three Line Strike
Main characteristics:
1. The number of candlesticks: 4;
2. Frequency: Medium;
3. Color: The first three candlesticks are bearish, and the fourth is bullish;
4. Key features: After the three strong bearish candles that close progressively lower, the fourth one opens below them but then closes above the opening of the first candlestick.
This is yet another controversial pattern. After three bearish candlesticks, buyers try to take over the market. As a result, it forms a big bullish candlestick. The tricky part is that the last two candlesticks may resemble bullish, engulfing patterns. Therefore, you need to remember the following rule: if the next candlestick after the pattern closes above the bullish candlestick, it indicates a bullish reversal. On the contrary, if the subsequent candlesticks after the pattern do not exceed the last candle’s high, this situation shows that the trend is ongoing.
Congratulations! Now you know more signs.
Lesson summary
Continuation candlestick patterns represent a group of candlestick patterns that indicates that a trend will resume;
When a continuation candlestick pattern appears, it doesn’t mean the market will reverse immediately. Thus, we may see a correction after the pattern itself;
The easiest continuation patterns you can notice are the Rising and the Falling Windows. You probably know them as continuation gaps;
You need to be careful with some continuation patterns, such as the Three Line Strike and the Gap Three Methods, as they can have reversal setups in their structure.
Coming up
In the final lesson of this course, we will learn how to apply Japanese candlestick patterns in practice. You’ll get to know new trading strategies that even a beginner can master. Stay tuned!