They could be called hotdogs if they were invented in the USA. However, around five centuries ago, Japanese people came up with a more elegant name. Now, traders all over the world use Japanese candlesticks for market analysis.
The unique market signals and visual convenience of Japanese candlesticks are the main reasons why traders prefer them for market analysis. If you want to learn the secrets behind the candlestick chart and predict signs of reversal by finding candlestick patterns, this course is for you.
By successfully passing this course, you will:
Master the main candlestick types;
Spot candlestick patterns and interpret their meaning;
Learn effective trading strategies with candlestick patterns.
Make your first steps in understanding the skills and knowledge invented by Japanese sensei!
What are candlesticks?
Japanese candlesticks are the core elements of the candlestick chart. A single candlestick shows the dynamics of a price during a particular period.
Open the weekly timeframe. One candlestick there will show a 1-week change in the price. So, this is how the market behaved from Monday to Friday. Now go to the 5-minute chart. Do you see candlesticks swinging up and down? On this chart, one candlestick demonstrates a change in the price within 5 minutes.
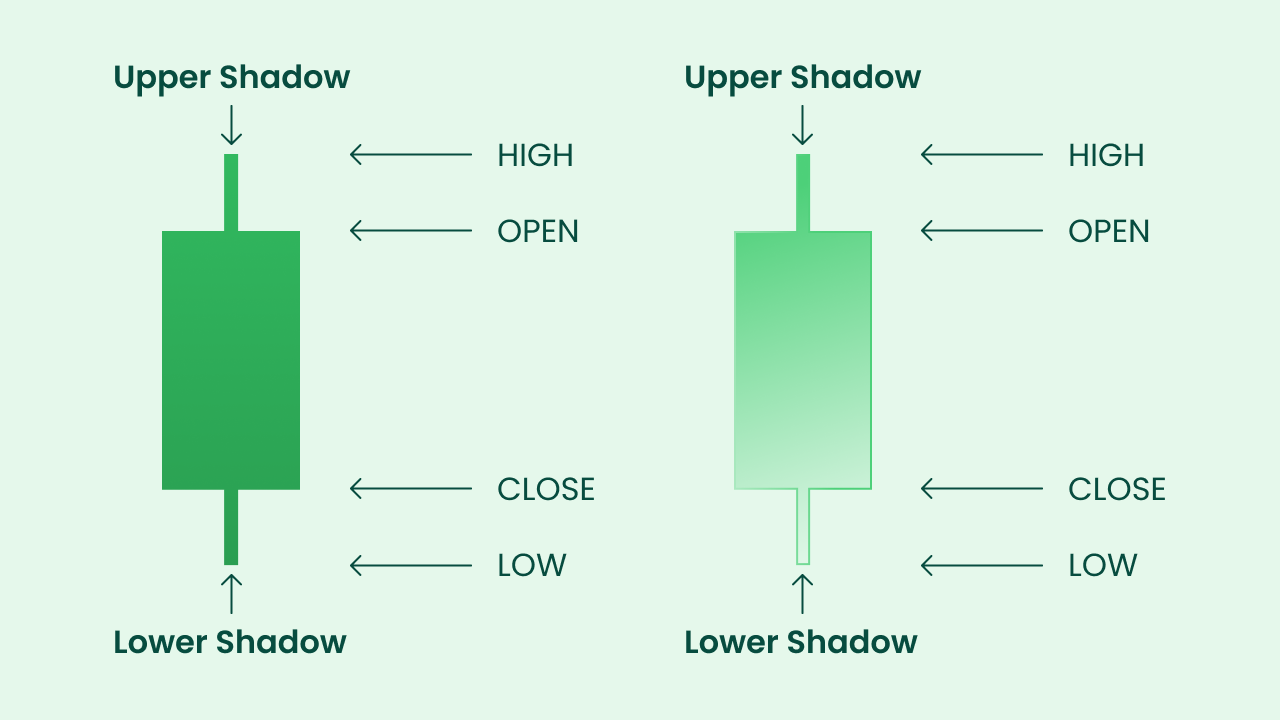
A single candlestick consists of three main parts.
A real body – the thick part of a candlestick. This is an area between the open and the close prices;
An upper shadow (wick, tail) – the vertical line above the real body. It shows the high of the session;
A lower shadow (wick, tail) – the vertical line below the real body. It shows the low of the session.
If the prices rose during the period, the candle is usually painted in white or green. In this case, the opening price is at the bottom of the body, and the closing price is at its top. This candlestick is called bullish.
If the prices fell during the period, the candle is usually painted in black or red. In this case, the opening price is at the top of the body, and the closing price is at its bottom. This type of candlestick is named bearish.
"On the Internet, I see many candlestick charts. Strangely enough, they are all colored differently. Sometimes, I stumble across black and white candlesticks, in other times – green and red ones. Do the colors of the candlesticks really matter?"
To tell the truth, it does not matter how you decide to design your charts. However, you should define two colors for bullish and bearish candlesticks. In FBS, we use green for bullish candlesticks and red for bearish ones.
Candlestick chart
Although the candlestick chart and its American brother – bar chart – have similarities as they use the same data, they are different. Have a look at the picture below, where we placed a bar chart (on the left) and a candlestick chart (on the right).
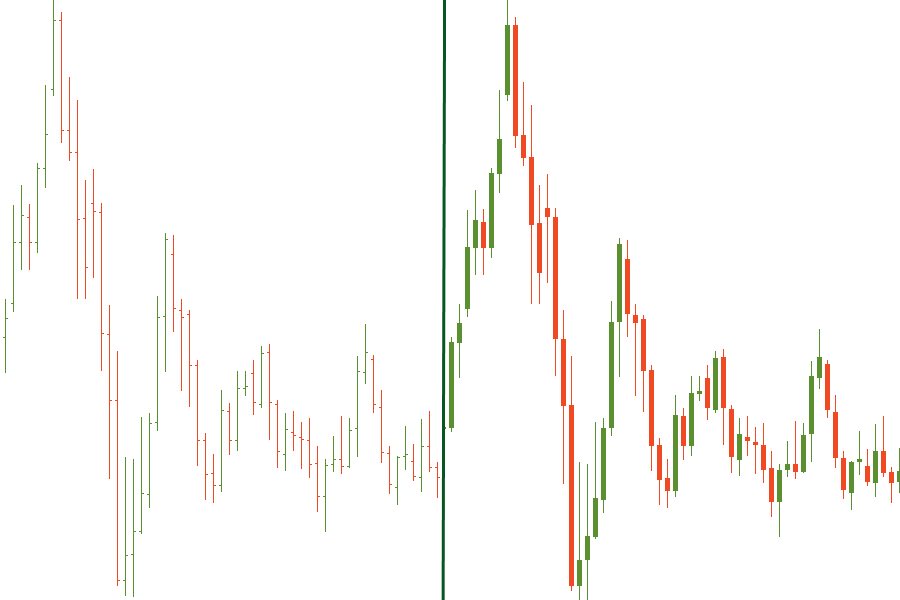
A сandlestick chart is more informative than a bar chart. See for yourself: real bodies of candlesticks give us a visual representation of the market situation. If the body of a candlestick is long, it shows a very active session. On the contrary, candlesticks with small bodies signal a calm market. We pay a lot of attention to the form of a candlestick’s body and to the size of its shadows, as they may reveal all the secrets hidden behind the market’s picture.
"I still think there is not so much difference between the bar chart and the candlestick chart. Can you give a clear example of the candlestick chart’s superiority over the bar one?"
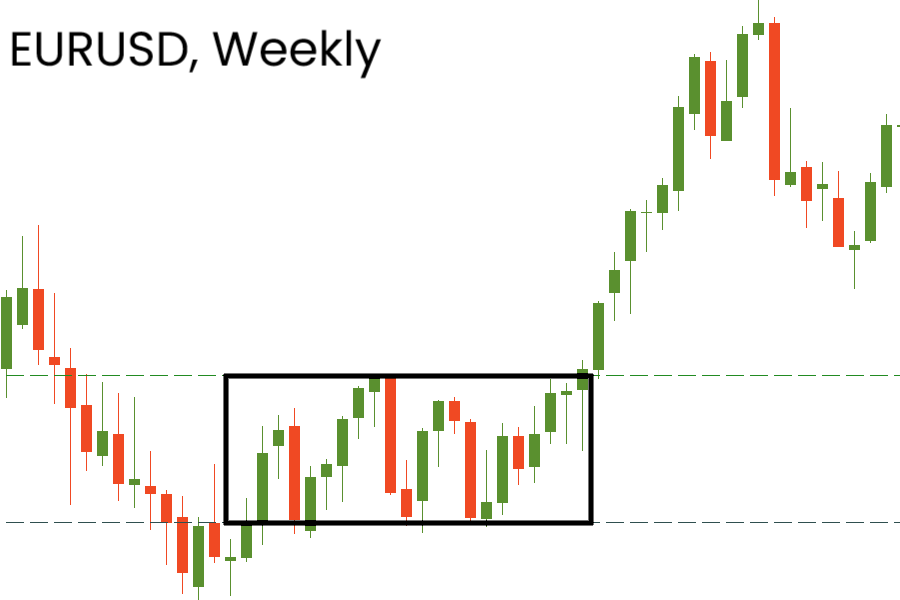
Let’s have a look at the weekly chart of EURUSD. We highlighted a period of horizontal consolidation in a rectangle. With a bar chart, it’s almost impossible to see what candlesticks this rectangle consists of. On the contrary, the candlestick chart gives us a clear picture. We can see that there are more green candlesticks than red ones inside the pattern. With such a quantity of candlesticks inside the pattern, we get additional confirmation of further upside momentum.
In the next part of this lesson, we are going to observe the main types of candlesticks and see what they can tell us about the price.
Types of candlesticks
As mentioned above, the shapes and sizes of candlesticks can tell a lot about the nature of price action. Traders and investors define several main types of candlesticks that have their unique features. Don’t be afraid; they are really easy to spot!
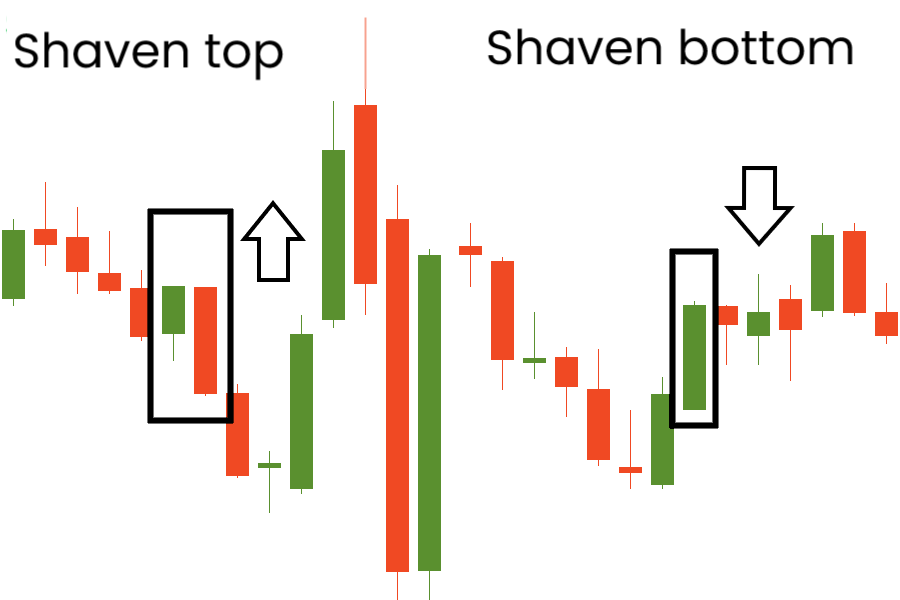
Shaven head and shaven bottom
If a candlestick has no upper tail, traders call it a “shaven head” candlestick. It tends to show the bearish dynamics in the market.
On the contrary, a candlestick without a lower shadow is known as a “shaven bottom.” This type of candlestick demonstrates that buyers press on.
You can see examples of these patterns in the picture below.
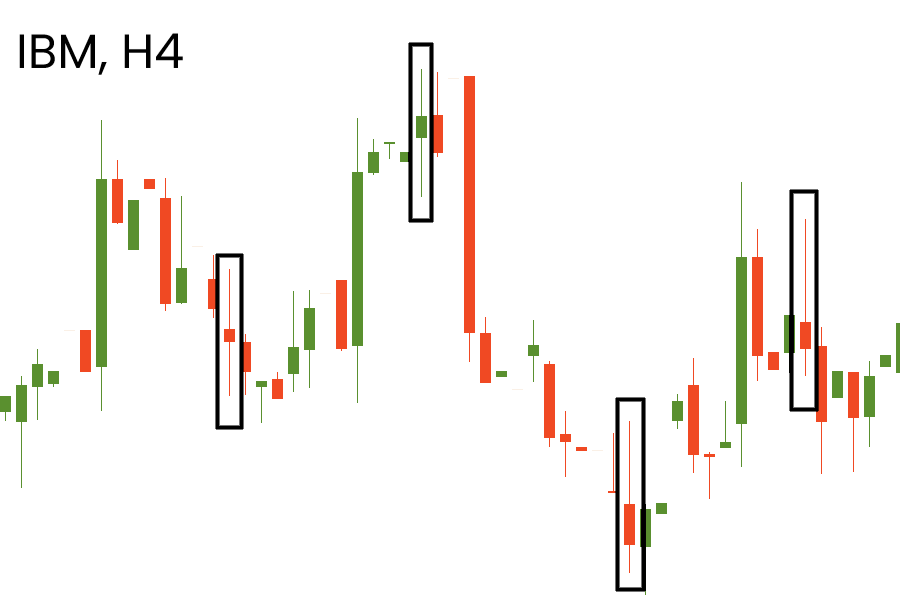
Spinning tops
A candlestick with a small real body and long upper and lower shadows is called a “spinning top.” Spinning tops are the signs of the market’s indecision: both bulls and bears were active, but neither took over the market.
After a long advance or a long bullish candlestick, a spinning top indicates weakness among buyers and a potential change or interruption in a trend.
After a long decline or a long bearish candlestick, a spinning top indicates weakness among sellers and a potential change or interruption in a trend.
On the H4 chart of IBM, several spinning tops indicate the change in the market’s direction.
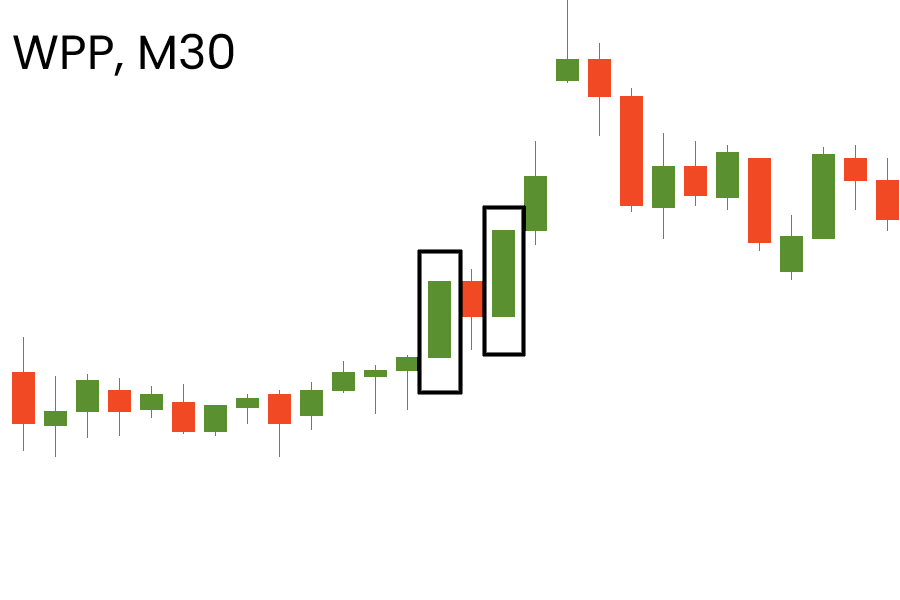
Marubozu
Now imagine that a candlestick has a very thick body and no upper or lower shadows. This candlestick has a very Japanese name – Marubozu.
A bullish Marubozu is formed when the opening price equals the minimum price, and the closing price equals the maximum. It shows that buyers controlled price action during the entire period.
A bearish Marubozu is formed when the opening price equals the maximum price, and the closing equals the minimum price. It shows that sellers controlled price action.
On the M30 chart of the WPP stock, two Marubozu candlesticks demonstrated the strength of the bullish trend.
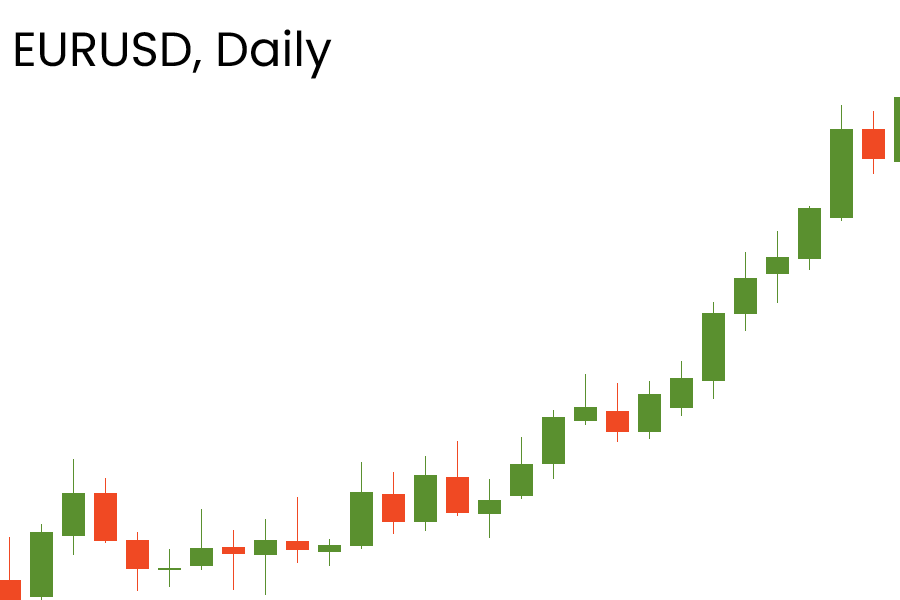
Candlestick with short shadows
One of the most common candlestick types is a candlestick with short shadows. Candlesticks with short shadows indicate that most of the trading action was confined near the open and close prices.
On the daily chart of EURUSD below, candlesticks with short shadows formed an uptrend.
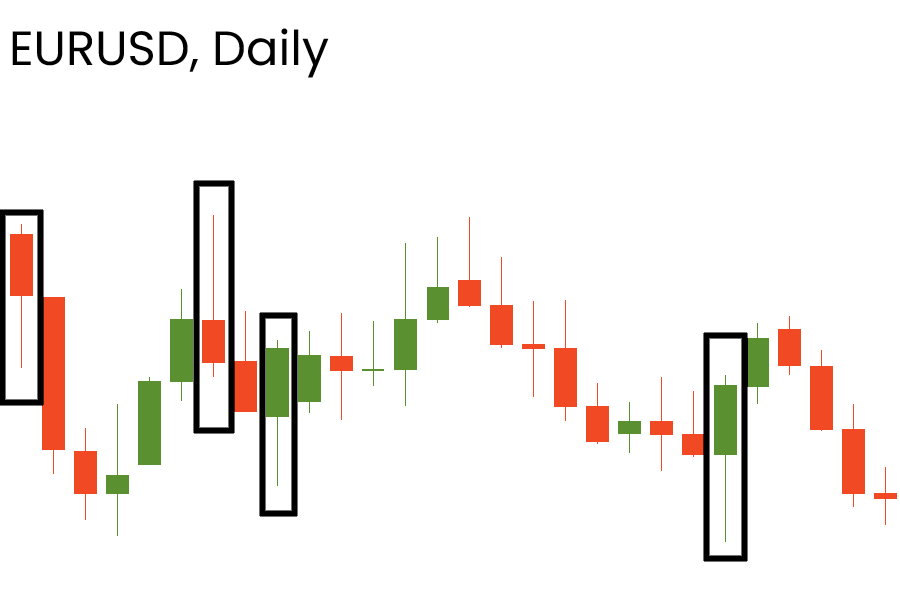
Candlestick with a long upper shadow
Candlesticks with a long upper shadow and short lower shadow indicate that buyers dominated during the session, but sellers managed to pull prices down from their highs by the end of the period. Such a candlestick is usually followed by a decline in price.
Candlestick with a long lower shadow
Vice versa, a candlestick with a long lower shadow shows that sellers dominated during the session, but the price managed to close higher. The price often rises after candlesticks like this.
On the daily chart of EURUSD below, we can see candlesticks with long lower and upper shadows.
Doji
A candlestick with an ultra-small real body (open and close prices are almost equal) is called a “doji.” If this candlestick is formed, neither bulls nor bears dominate the market. The market is uncertain. The doji candlestick is a tricky one. On its own, it does not tell us much. However, it can become a significant indicator of reversal if certain conditions in the market are implemented.
"Oh, this is cool! Tell me, please, when does it mean reversal?"
In general, a doji candlestick becomes a reversal candlestick when the following conditions are met:
A doji is formed after a series of bullish candles with long bodies (during an uptrend) or after a series of bearish candles with long bodies (during a downtrend). Usually, it signals a trend’s weakness;
The candlesticks after the doji confirm the reversal (see the lesson “Reversal candlestick patterns”);
The market conditions are overbought or oversold.
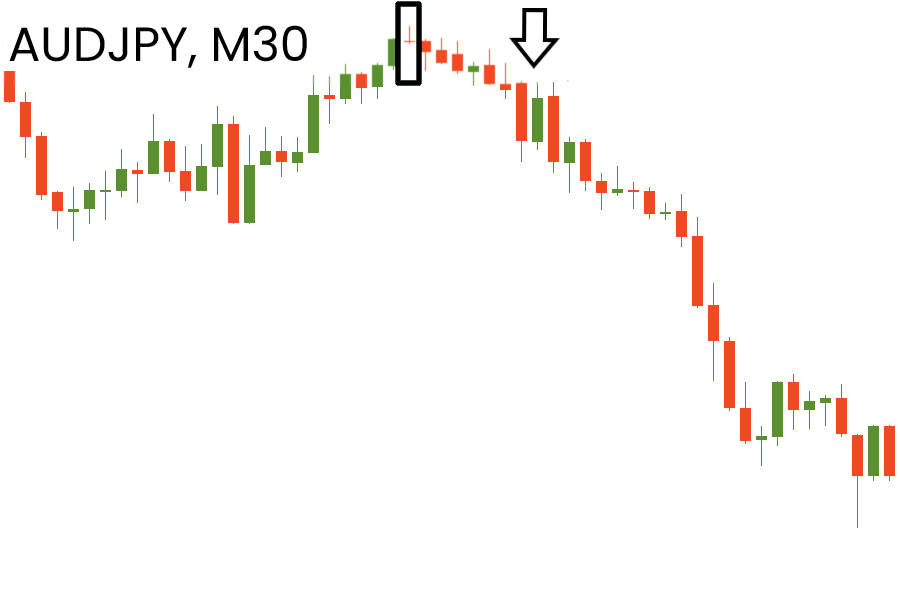
For example, on the M30 chart of AUDJPY, a doji candlestick was formed and indicated a bearish reversal.
In the classic literature dedicated to candlesticks, you can find four types of doji. Let’s look at them in the picture below.
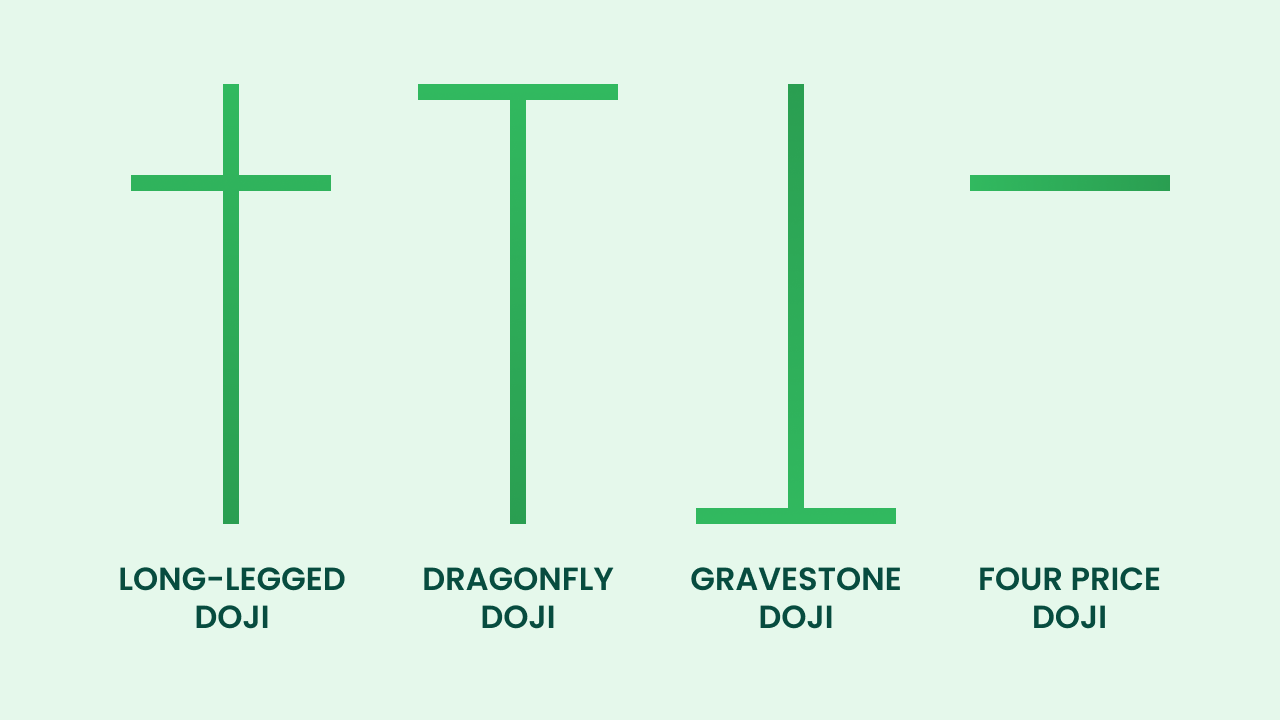
Long-legged doji has long upper and lower shadows that are almost equal in length and reflect a great amount of indecision in the market.
Dragonfly doji is a significant bullish reversal pattern that mainly occurs at the end of downtrends.
Gravestone doji is a significant bearish reversal pattern that mainly occurs at the top of uptrends.
Four-price doji is very rare and represents complete and total uncertainty by traders concerning the market direction.
In the first Western study dedicated to Japanese candlesticks, Steve Nison defines the Northern doji and the Southern doji. The former describes the doji during the downtrend, and the latter – the doji during the uptrend.
The doji candlesticks can be even more relevant if they are part of candlestick patterns. Japanese traders defined many different types of candlestick patterns that helped them predict further market movements.
Now you know the main types of candlesticks that occur in the market. Let’s revise your knowledge.
Lesson summary
Candlesticks are the elements of the candlestick chart. A candlestick consists of upper and lower shadows and a real body;
Candlesticks help to predict the current strength of a trend, may serve as support or resistance, and give signals of a potential change of the market’s direction;
There are various types of candlesticks: shaven head and shaven bottom, spinning tops, candlesticks with long and short shadows, Marubozu, and doji;
The doji candlesticks signal indecision in the market. They are often included in the candlestick patterns that signal a potential change in a trend.
Coming up
In the next lesson, we are going to look at the most famous candlestick patterns in detail. Are you interested? Keep learning!