Japanese traders invented many candlestick patterns. All of them have stood the test of time. Not only retail traders but also big financial companies analyze candlestick charts to predict further momentum. If traders see a candlestick pattern and it’s very recognizable, they follow the signal of the pattern. As a result, the probability of the signal’s implementation is high.
There are two main types of candlestick patterns: reversal and continuation. This lesson is dedicated to the reversal ones.
Reversal candlestick patterns form a group of candlestick patterns that indicates that a trend will change direction or make a deep correction.
"So, does it mean that if I hear the term “reversal pattern,” the change of a trend will happen right away?"
We wish! However, in reality, trend changes come slowly, step by step. Reversal candlestick patterns indicate that the prior trend is likely to change but not necessarily reverse.
Two factors increase the strength of a signal given by a reversal pattern:
The preceding trend is strong and steep;
The reversal pattern appears near a strong resistance or support level.
Bullish patterns
We will start with bullish patterns that indicate the price reversal to the upside. They appear at the end of downtrends.
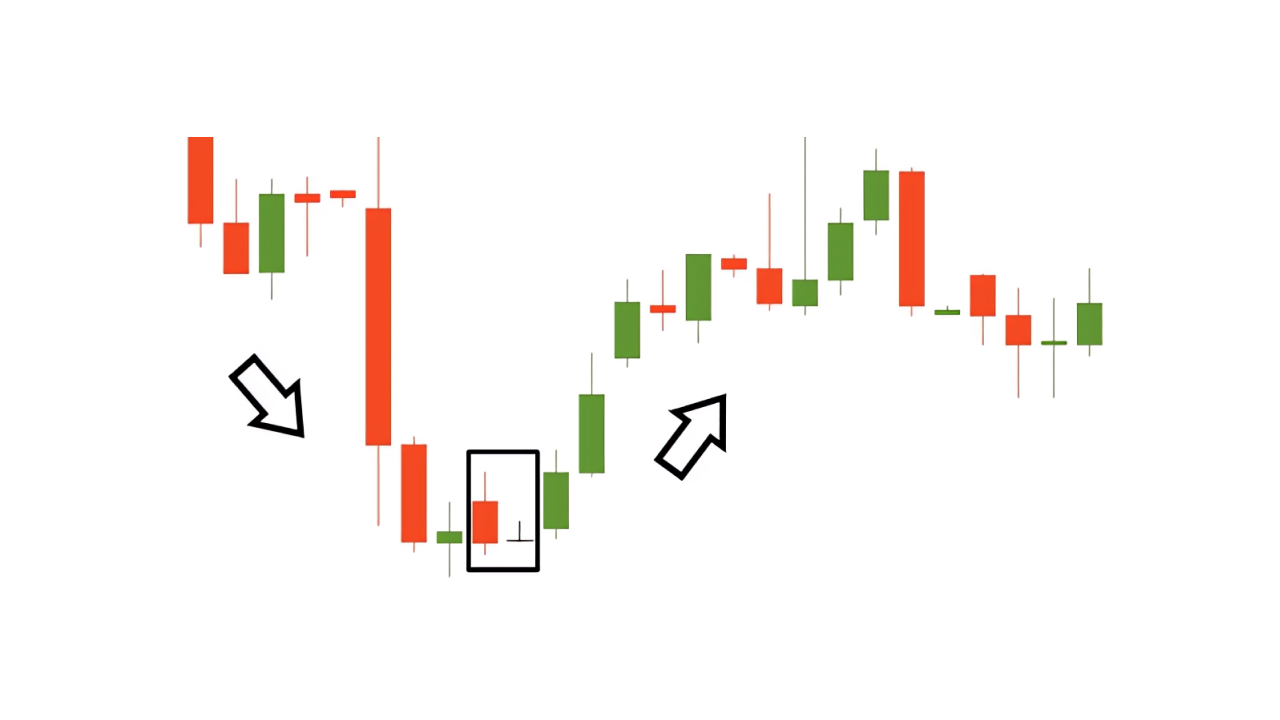
Hammer
Main characteristics:
1. The number of candlesticks: 1;
2. Frequency: high;
3. Color: it doesn’t matter, but bullish is better;
4. Key features: short body, short upper shadow, long lower shadow.
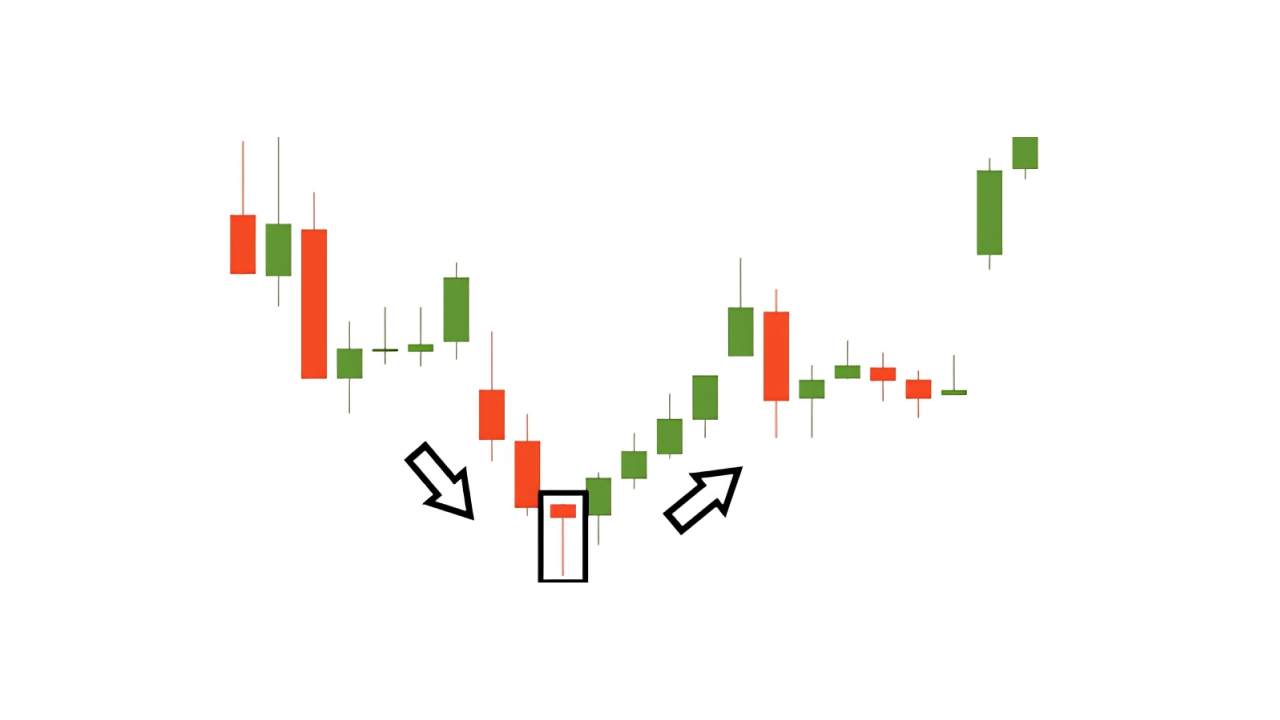
For sure, Thor’s favorite reversal pattern is the Hammer. Indeed, it looks like a hammer! The candle has a long lower shadow, which should be at least twice the length of the real body. Hammers show that although bears could pull the price to a new low, they failed to hold it there and lost a battle with buyers by the end of a trading period.
The signals of hammers are more reliable when:
A hammer forms after a long downtrend;
A hammer is followed by a candlestick that closes above the opening price of the hammer.
Inverted hammer
Main characteristics:
1. The number of candlesticks: 2;
2. Frequency: Medium;.
3. Color: The first candle is bearish; the color of the second doesn’t matter;
4. Key features: The first candle is in the downtrend, the second has no lower shadow or a very short one, and a long upper shadow. The real body of the second candle is small.
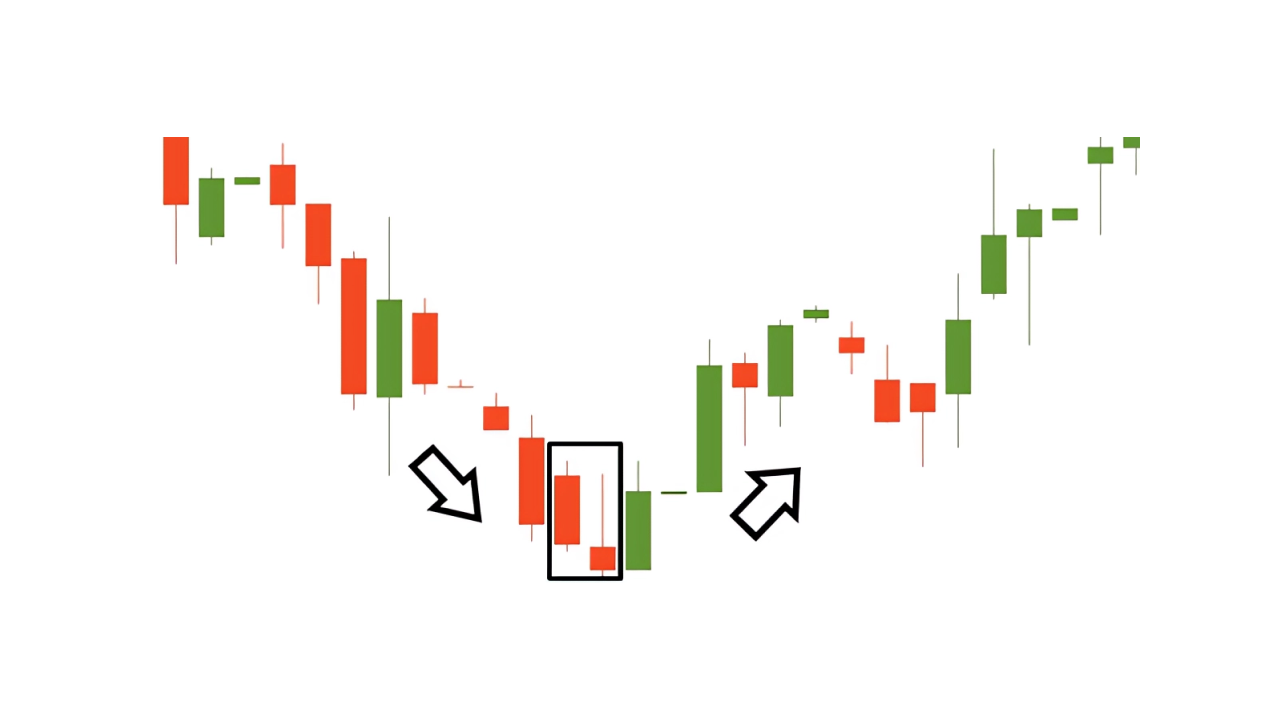
This is the hammer pattern turned upside down. However, apart from the hammer, this setup requires the bearish candlestick before the inverted hammer itself. Its signal is more reliable when the second candlestick is bullish. The pattern needs confirmation in the form of a breakout of the nearest resistance zone or a trend line.
Morning star
Main characteristics:
1. Number of candlesticks: 3;
2. Frequency: Medium;
3. Color: The first candle is bearish, the second candle is bullish/bearish, and the third candle is bullish;
4. Key features: The first candle is in a downtrend, the second appears after the gap down, the third candle opens with a gap up, and the third candle closes at least halfway up the body of the first line.
Here’s a small Astrology lesson for you! The “morning star” is the nickname for the planet Mercury. If you look at the sky and see it, the sunrise will start soon. It is the same with prices: when a morning star appears, the price will go up.
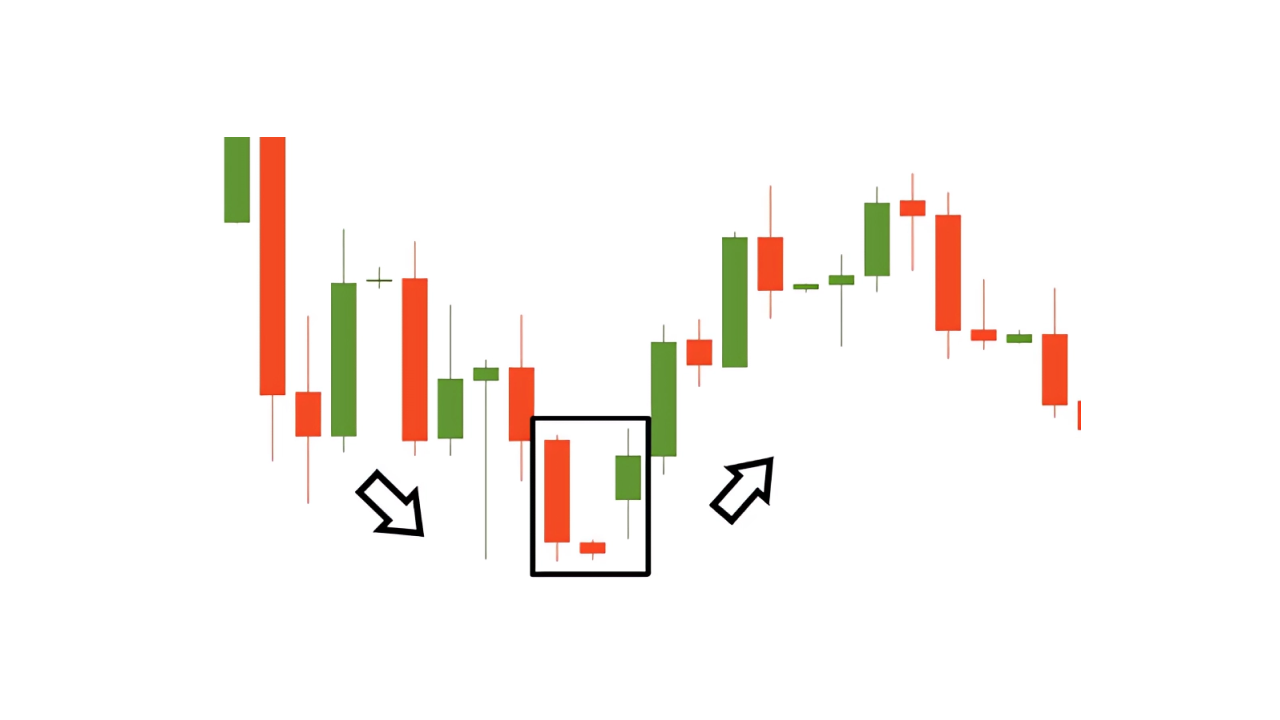
The first candlestick of the pattern should be bearish, with a big real body. The second candlestick should open with a gap down (below the body of the first) and have a small real body. It shows that sellers get weaker. The color of this candlestick doesn’t matter. The third candlestick should fill in the previous bearish gap. It should be bullish and close above the middle of the first candlestick.
The signals of morning stars are more reliable when:
The pattern appears after a strong downtrend;
The pattern is confirmed by breaking the trendline or the nearest resistance zone.
"Hmm… It looks like there should necessarily be a gap between the candlesticks of the morning star. Does this rule apply to all assets and charts?"
The ideal morning star should indeed have gaps between the candles it consists of. However, in some markets, there can be exceptions to this rule, where the open and close are either the same or close to each other. You can find such patterns in the Forex market and on the intraday patterns (for example, 5-minute or 15-minute charts).
Morning doji star
Main characteristics:
1. The number of candlesticks: 3;
2. Frequency: Rare;
3. Color: The first candle is bearish, the second candle is bullish/bearish, and the third candle is bullish;
4. Key features: The pattern is almost the same as the morning star, but the second candlestick is doji.
As you’ve probably guessed from its name, the morning doji star is practically the same as the regular morning star, but the second candlestick is doji. It provides a stronger signal than the average doji star.
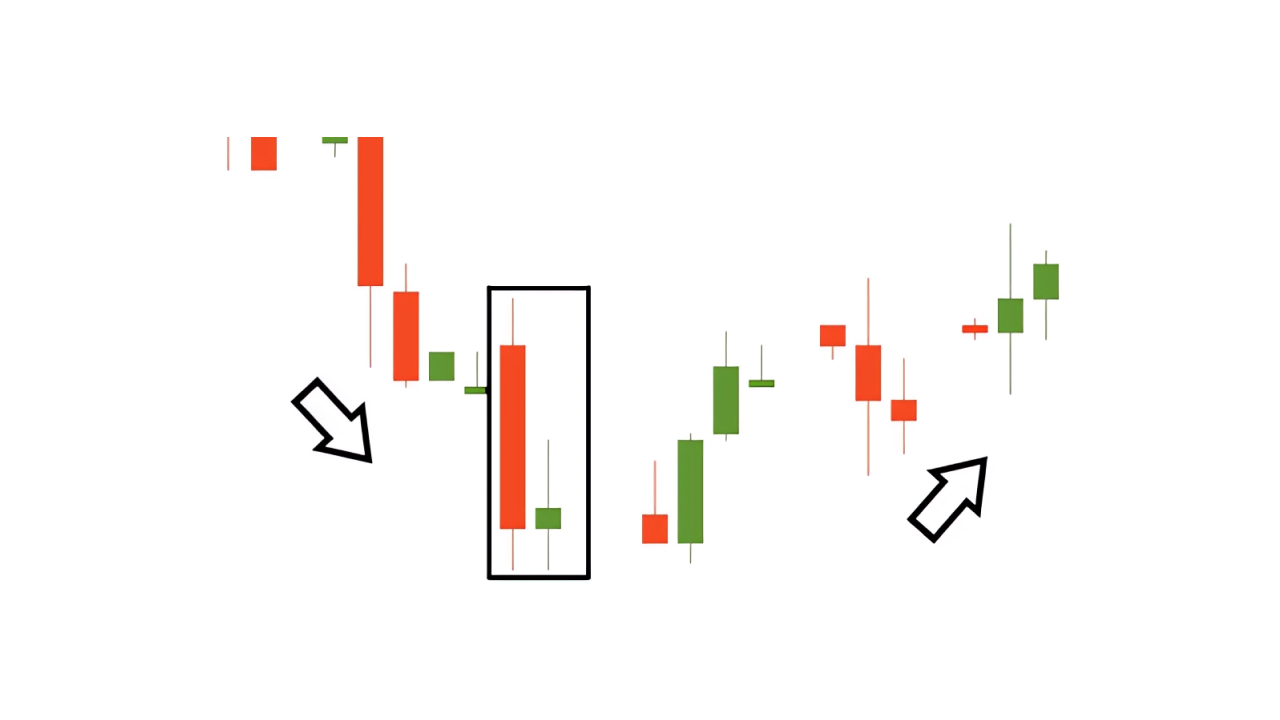
Piercing line
Main characteristics:
1. The number of candlesticks: 2;
2. Frequency: Medium;
3. Color: The first candle is bearish, and the second candle is bullish;
4. Key features: the candles appear during the downtrend. The second candle opens below/equal to the prior low. The closing price of the second candle should be above the middle of the previous candle’s body but below the previous open price.
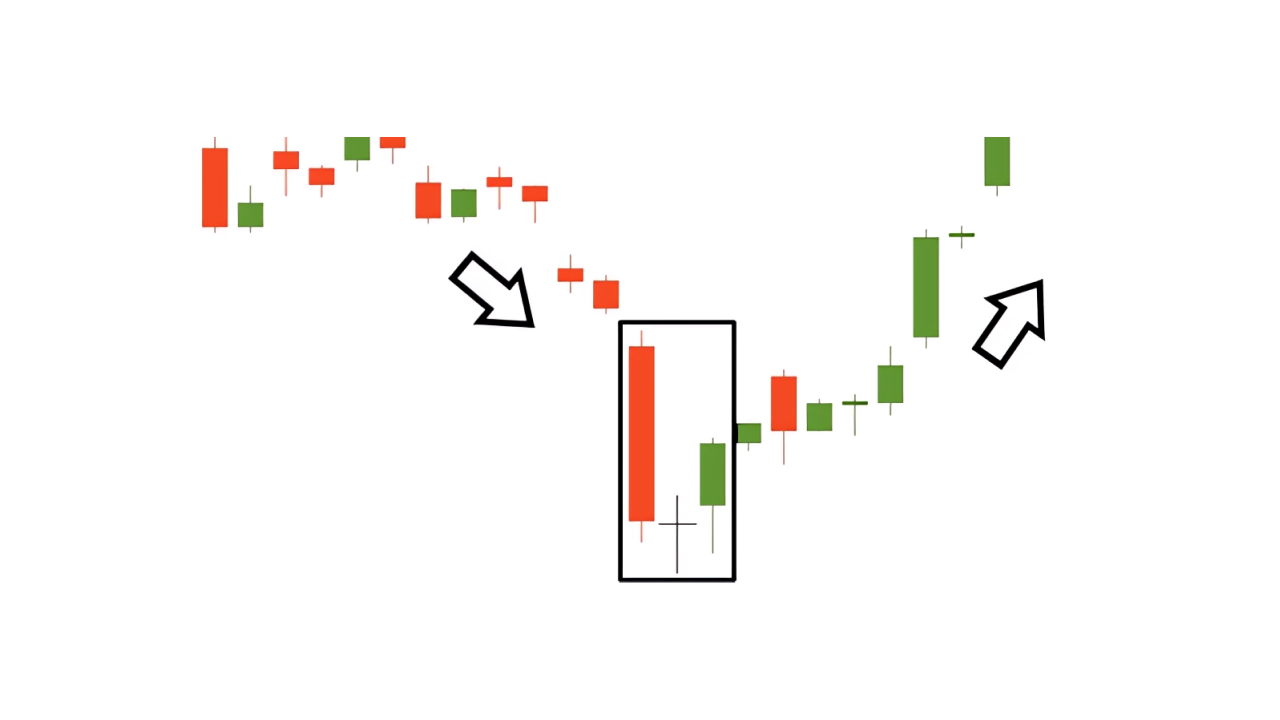
The piercing line is known as one of the classic bullish reversal patterns. The price gaps downwards after the first bearish candlestick, but bulls get stronger and push the price up. The first candlestick should be big and bearish. The following candlestick should be bullish and open below or equal to the prior low. The closing price of this candlestick should be below the previous opening. Both real bodies should be low enough. The pattern requires confirmation in the form of breaking out a significant level or a trend line.
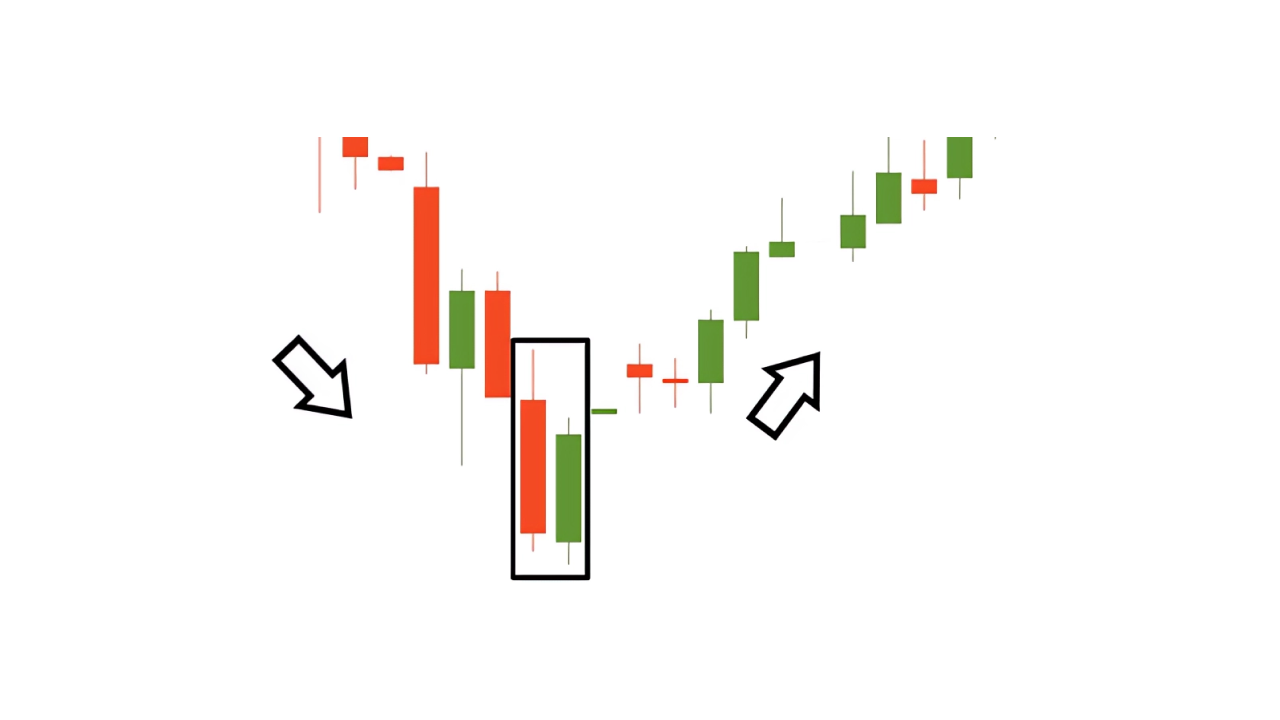
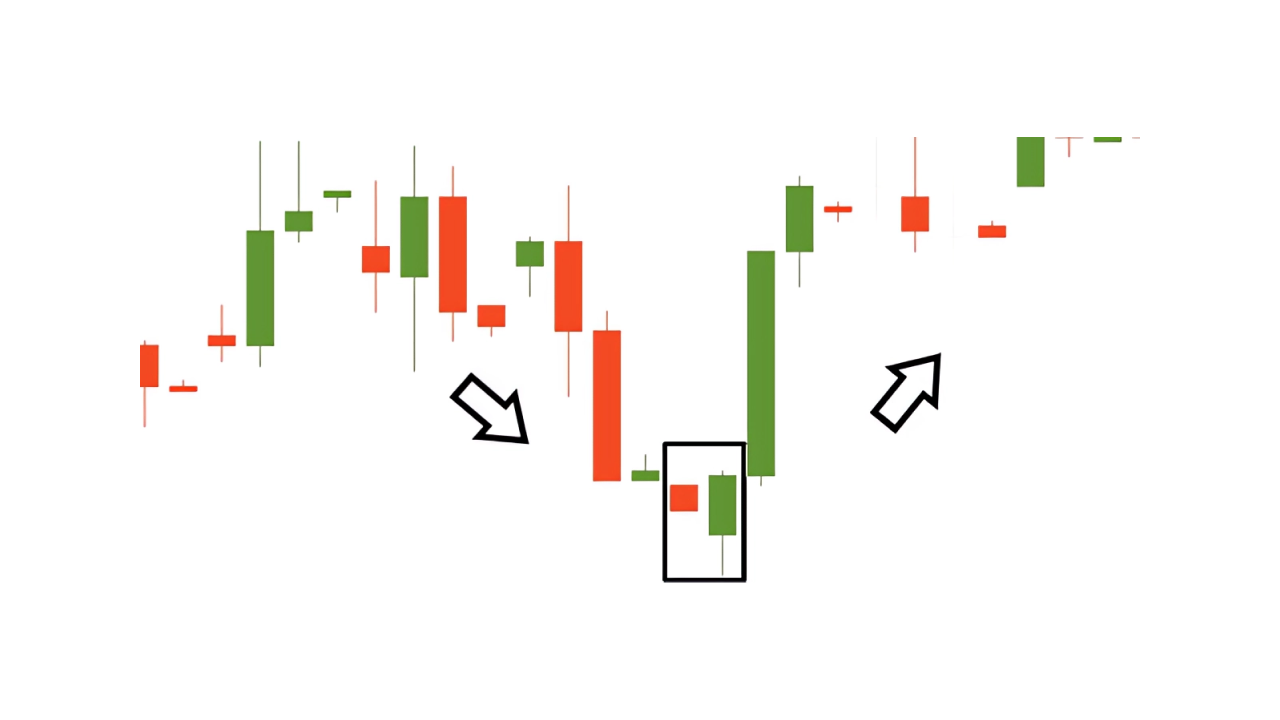
Bullish harami
Main characteristics:
1. The number of candlesticks: 2;
2. Frequency: Often;
3. Color: The first candle is bearish, and the second is bullish;
4. Key features: The candles appear during the downtrend. The second candle should be contained within the first candle's real body.
The word “Harami” means pregnant in Japanese. This is not a coincidence: the pattern looks like a candlestick about to give birth! The first candlestick is long and bearish, while the second is small. Moreover, the second candle should be “inside” the first candle's body. The reversal signal is stronger when a candle after the pattern closes above the closing price of the second (the “baby”) candlestick.
Bullish harami cross
Main characteristics:
1. The number of candlesticks: 2;
2. Frequency: Rare;
3. Color: The first candle is bearish, and the second candle is doji;
4. Key features: The candles appear during the downtrend. The second candle should be a doji inside the first candle's real body.
This situation is similar to when the bullish harami occurs, but the second candlestick is doji. This pattern is stronger than the regular one.
Three inside up
Main characteristics:
1. The number of candlesticks: 3;
2. Frequency: Often;
3. Color: The first candle is bearish, the second candle is bullish, and the third candle is bullish;
4. Key features: An extension of the bullish harami pattern.
This is an extended bullish harami pattern discovered by Gregory Morris. After the bullish harami pattern, the third candle serves as a confirmation of a reversal. It closes above the second candle's price. The opening price of the second candle may be equal to the first candle’s closing price. A situation when the closing price of the second candle is similar to the opening price of the first candle is also possible. However, they should not occur at the same time. In this form, shadows do not matter.
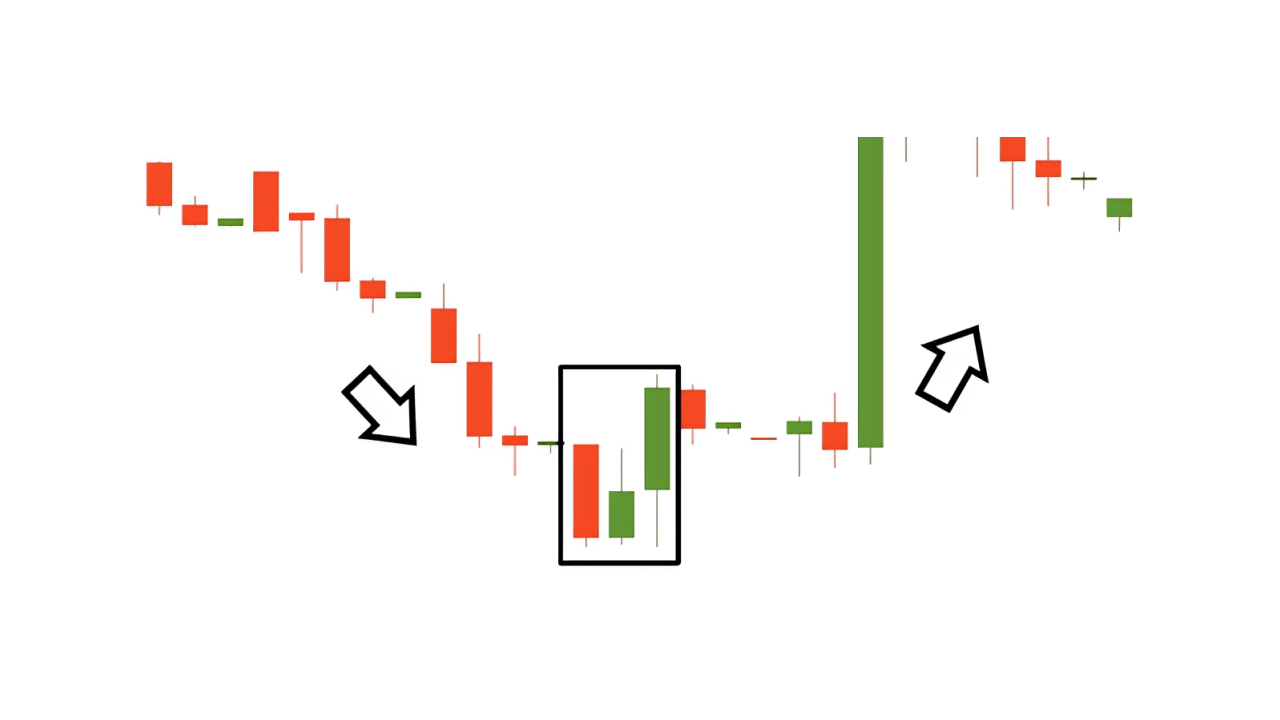
Tweezers Bottom
Main characteristics:
1. The number of candlesticks: 2, but you can add more;
2. Frequency: Rare;
3. Color: Any;
4. Key features: The candles can have any form except for the four-price doji. The low price should be equal to the previous low.
Although the pattern rarely appears on the chart, it tends to be reliable. When you trade this pattern, the key to success is to find candlesticks with equal lows that appear at the end of a downtrend.
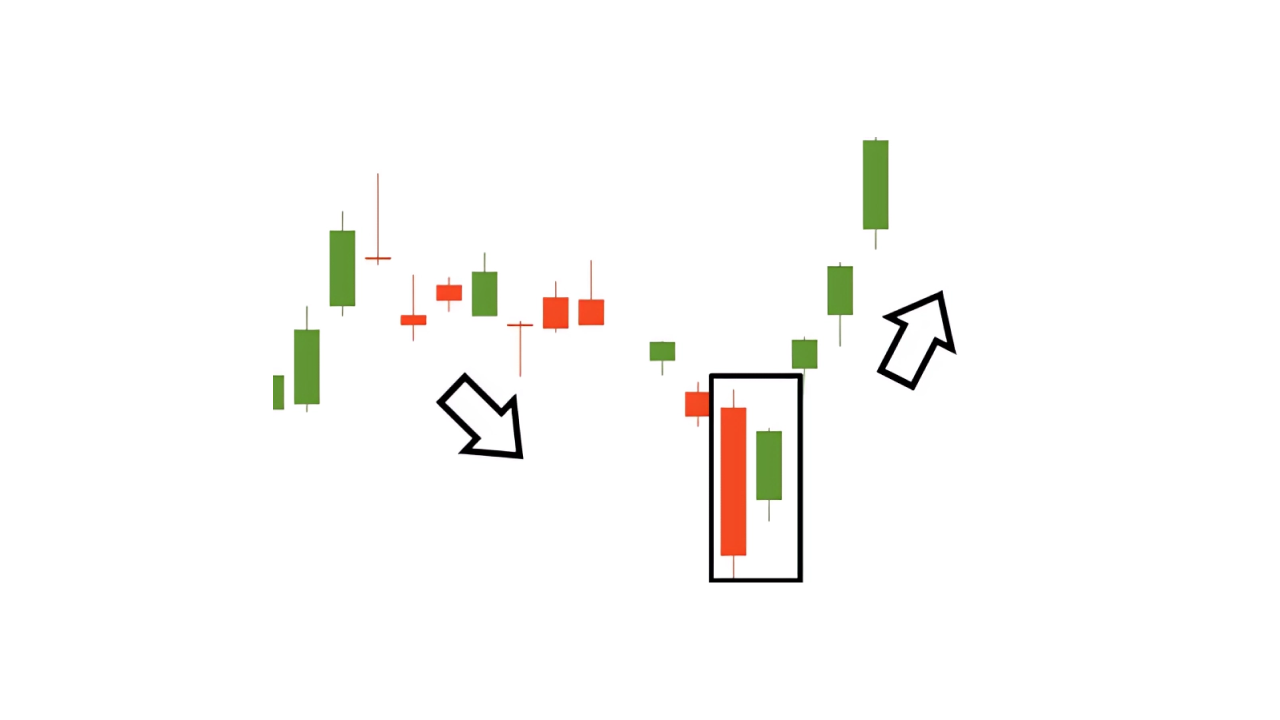
Bullish engulfing pattern
Main characteristics:
1. The number of candlesticks: 2;
2. Frequency: Often;
3. Color: The first candle is bearish, and the second candle is bullish;
4. Key features: The candles appear during the downtrend. The second candle should open below the low of the first candlestick low and close above its high.
A quite common bullish pattern that signals the reversal to the upside. This pattern produces a strong reversal signal as the bullish price action completely engulfs the bearish one. The bigger the difference in the size of the two candlesticks, the stronger the buy signal.
Three white soldier
Main characteristics:
1. The number of candlesticks: 3;
2. Frequency: Rare;
3. Color: Bullish;
4. Key features: Series of 3 bullish candlesticks. The first one appears as a part of the downtrend. Each candle should open within the previous body, better above its middle. Each candle closes at a new high, near its maximum.
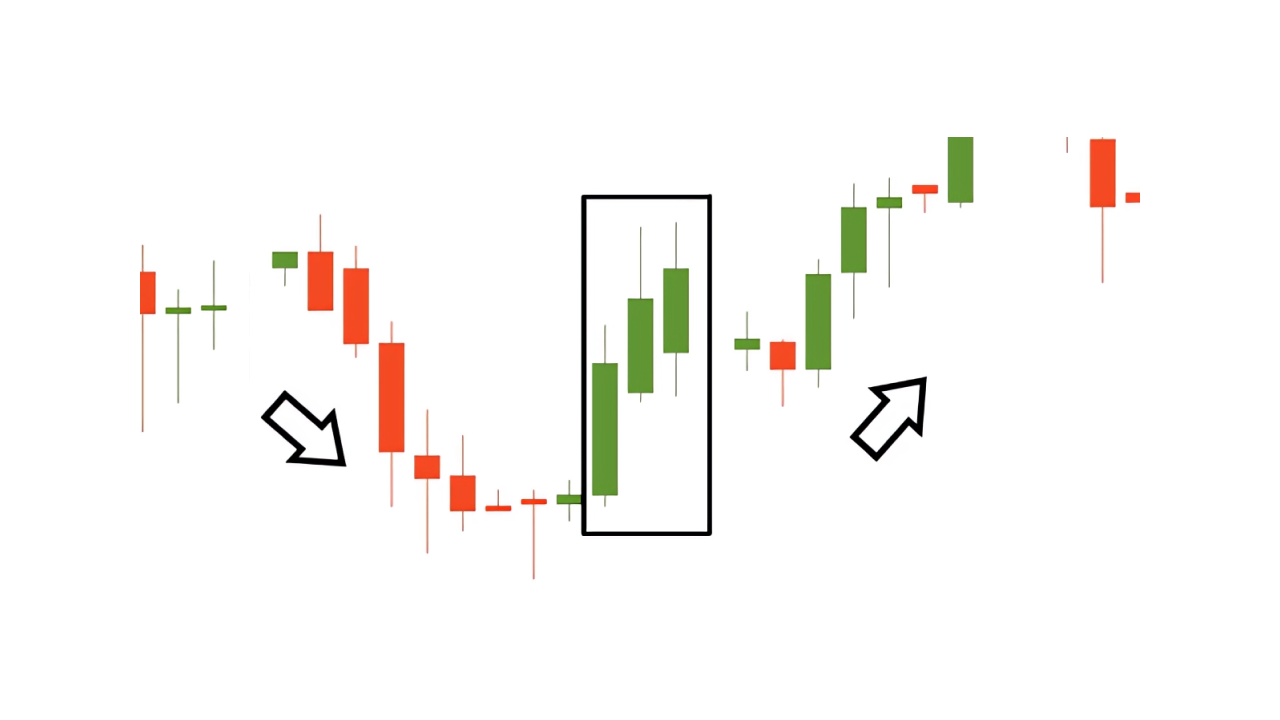
This is a rare pattern with a strong reversal signal. All three candlesticks should have big real bodies. After the first candlestick, the second opens within the body of the first one and closes above it. The third candlestick should open within the body of the second one and close above it. Phew, we want you to know these main bullish reversal patterns! There are more of them in reality, but they rarely appear on the charts. Now, let’s find out the main patterns that signal the reversal to the downside.
Bearish patterns
In this part of the lesson, we will have a closer look at the bearish reversal candlestick patterns. Besides the bullish reversal candlestick patterns, they signal the reversal to the downside.
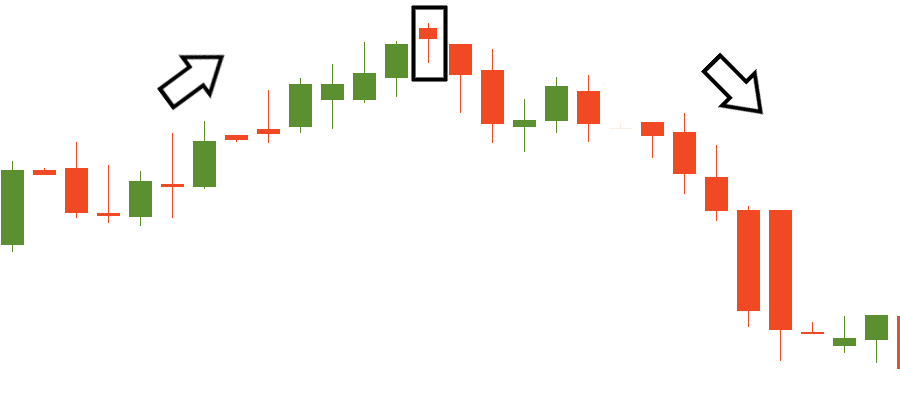
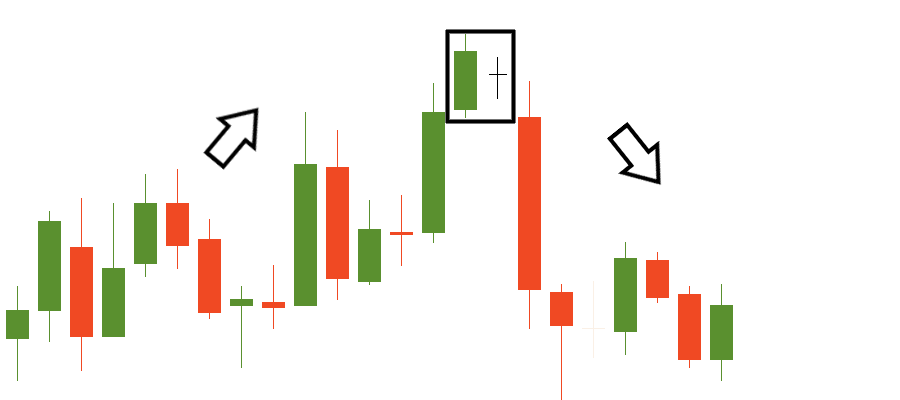
Shooting star
Main characteristics:
1. The number of candlesticks: 1;
2. Frequency: High;
3. Color: It doesn’t matter, but bearish is better;
4. Key features: Short real body, an upper shadow that is at least two times longer than the body, small lower shadow.
This is one of the most noticeable reversal candlestick patterns during an uptrend. When you see it, don’t forget to make a wish for a sell signal! The long upper shadow shows us that the price is no longer accepted by market participants. The real body of this pattern should be small, as well as the lower shadow.
The reversal signal is considered stronger when:
The upper shadow is very long;
There is a gap between the previous candlestick and the shooting star;
The candlestick is bearish.
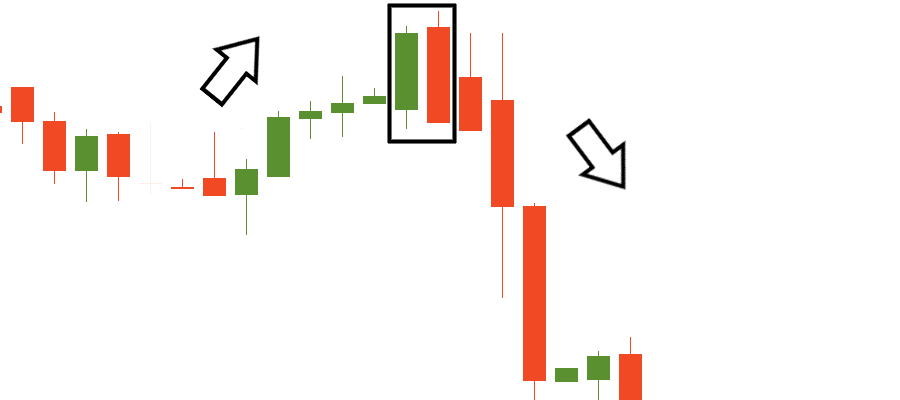
Evening star
Main characteristics:
1. The number of candlesticks: 3;
2. Frequency: Medium;
3. Color: The first candlestick is bullish, the color of the second one doesn’t matter, and the third candlestick is bearish;
4. Key features: the first candlestick is long, the second has a small real body, and the third is usually longer than the first. There is a gap up between the first and the second candlesticks. The third candlestick fills in the bullish gap.
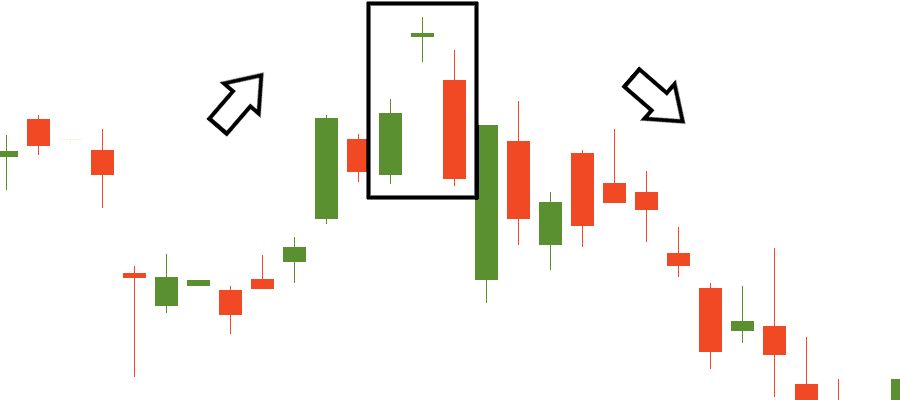
"This looks like a reversal to the downside, even visually!"
Exactly. The more often you look through the chats, the easier it will be for you to spot reversal patterns and act on them.
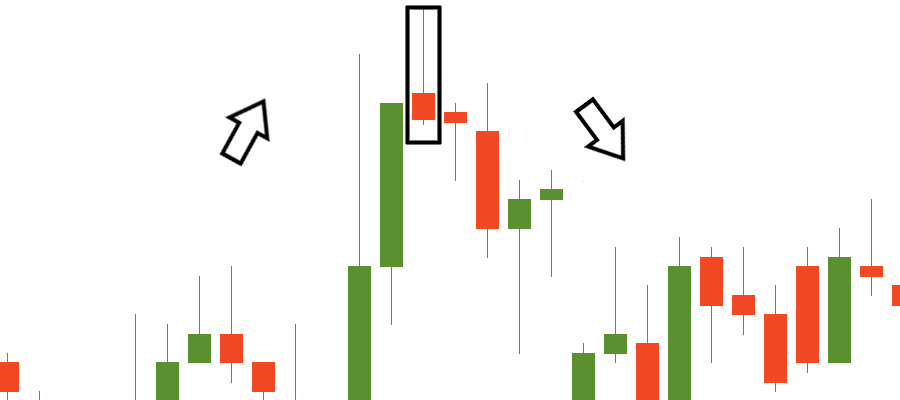
Evening doji star
Main characteristics:
1. The number of candlesticks: 3;
2. Frequency: Rare;
3. Color: The first candlestick is bullish, the second candle is doji, and the third is bearish;
4. Key features: The first and the third candles are long, and the second is a doji.
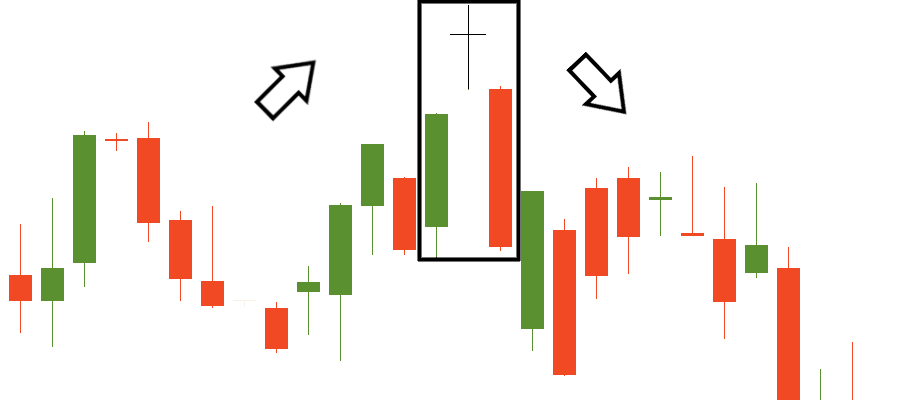
This is the same pattern as the evening star, but the second candle should be doji. Although it rarely occurs, the signal given by this pattern is strong, especially if the gaps are formed between the candles.
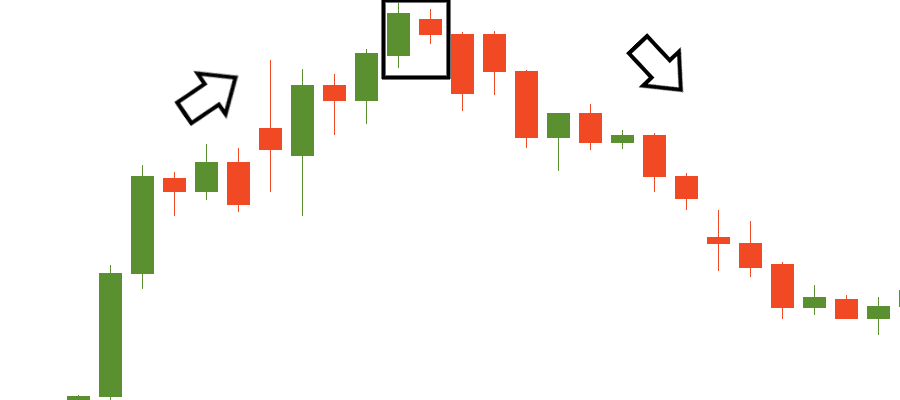
Hanging man
Main characteristics:
1. The number of candlesticks: 1;
2. Frequency: High;
3. Color: It doesn’t matter;
4. Key features: The candle has a small real body and a long lower shadow.
Is it a hammer? No, it’s a hanging man! Apart from the hammer pattern, this one appears at the end of the uptrend. It can signal an end of the bullish trend, a top, or a resistance level. The candle has a long lower shadow, which should be at least twice the length of the real body. It may be any color, though if it’s bearish, the signal is stronger.
The pattern is confirmed when a bearish candlestick closes below the opening of the candlestick on the left side of the pattern.
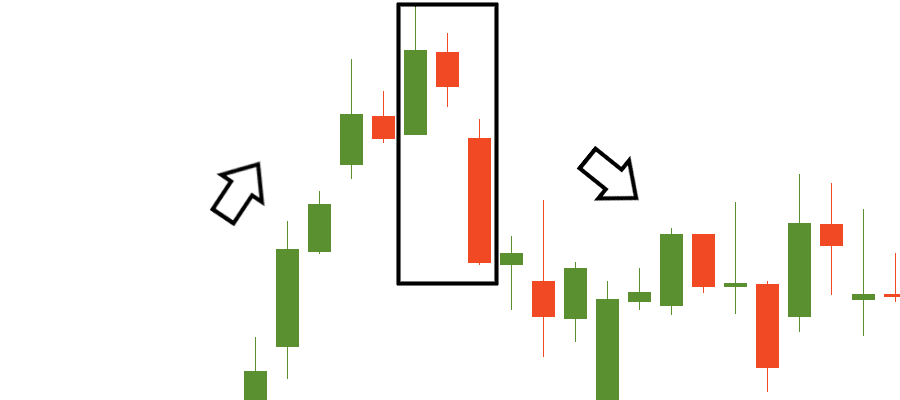
Dark cloud cover
Main characteristics:
1. The number of candlesticks: 2;
2. Frequency: Medium;
3. Color: The first candlestick is bullish, and the second candlestick is bearish;
4. Key features: The first candlestick is long; the second should open above the first one and close below 50% of the first candlestick’s body.
This is the bearish brother of the piercing line pattern. The second bearish candlestick tests highs above the first but fails to keep the bullish momentum. As a result, the price reverses to the downside. Confirmation in the form of a support level breakout makes the signal stronger.
Bearish harami
Main characteristics:
1. The number of candlesticks: 2;
2. Frequency: Often;
3. Color: The first candle is bullish, and the second candle is bearish;
4. Key features: The candles appear during the uptrend. The second candle should be contained within the first candle's real body.
The “pregnant” candlestick appears at the end of an uptrend. That is, the body of the second candle is completely contained within the body of the first one and has the opposite color. The signal of this pattern is confirmed when the following candlestick is big and bearish.
Bearish harami cross
Main characteristics:
1. The number of candlesticks: 2;
2. Frequency: Rare;
3. Color: The first candle is bullish, and the second is doji;
4. Key features: The candles appear during the uptrend. The second candle should be a doji inside the first candle's real body.
This is a rare setup with a doji candlestick inside the real body of the first candlestick. The signal is strong if the next candle after the pattern gaps down.
Three inside down
Main characteristics:
1. The number of candlesticks: 3;
2. Frequency: Often;
3. Color: The first candle is bullish, the second is bearish, and the third is bearish.
4. Key features: an extension of the bearish harami pattern.
According to Gregory Morris, the third candlestick that closes below the second’s closing price is so important that it should be part of the bearish harami pattern. The shadows in this candlestick pattern don’t matter. The pattern is confirmed when the support or a trend line is broken.
Tweezers Top
Main characteristics:
1. The number of candlesticks: 2, but you can add more;
2. Frequency: Rare;
3. Color: Any;
4. Key features: The candles can have any form except for the four-price doji. The high of the second candle should be equal to the previous high.
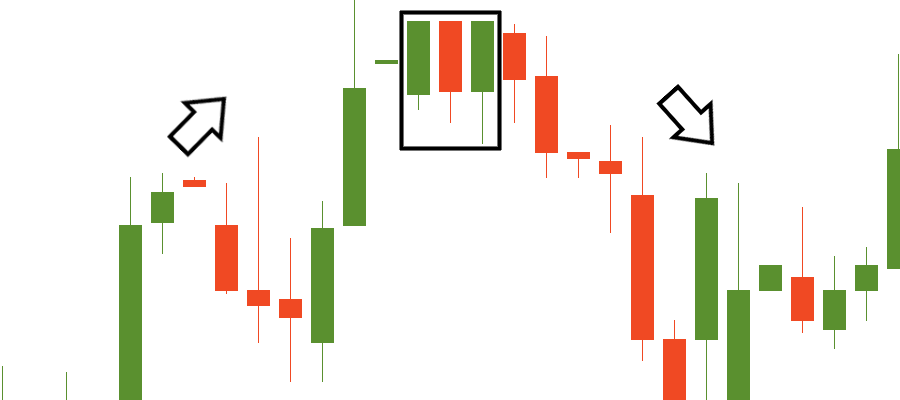
A unique pattern that signals the reversal to the downside. The candlesticks may have any form except for the four-price doji.
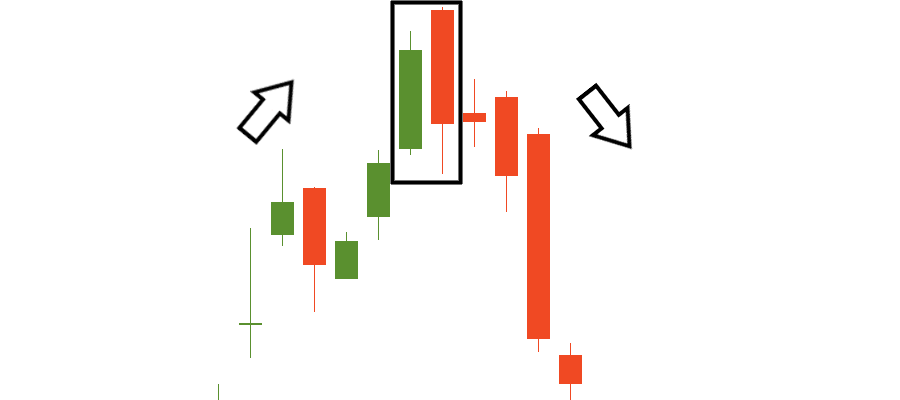
Bearish Engulfing
Main characteristics:
1. The number of candlesticks: 2;
2. Frequency: Often;
3. Color: The first candle is bullish, and the second candle is bearish;
4. Key features: The candles appear during the uptrend. The second candle should open above the high of the first candlestick and close below its low.
You can meet this pattern on the chart very often. After the bullish candlestick, the second is bearish and opens above the first candlestick’s high. The signal is confirmed if it closes below the first candlestick’s low. This pattern produces a strong reversal signal as the bearish price action completely engulfs the bullish one. The bigger the difference in the size of the two candlesticks, the stronger the sell signal.
Three black crows
Main characteristics:
1. The number of candlesticks: 3;
2. Frequency: Rare;
3. Color: Bearish;
4. Key features: Series of three bearish candlesticks. Each candle opens within the body of the previous one, better below its middle. Each candle closes at a new low, near its minimum.
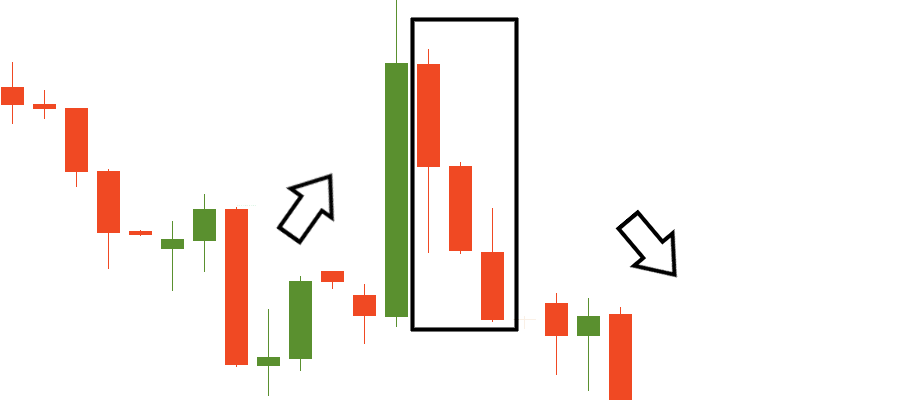
The three bearish candlesticks indicate the beginning of a new trend. This pattern is quite reliable. However, a confirmation is still suggested. It may look like a bearish candlestick with a lower close or a gap down.
We introduced you to the main types of reversal candlestick patterns. We highly recommend you save this lesson or make notes for better understanding and faster learning. Let’s summarize what we've learned!
Lesson summary
Reversal candlestick patterns represent a group of candlestick patterns that indicates that a trend will change direction or make a deep correction;
There are bullish and bearish reversal candlestick patterns. Bullish candlestick patterns indicate a reversal to the upside, while bearish candlestick patterns signal a reversal to the downside;
The reversal candlestick patterns show that the reversal is likely but unnecessary. For a reversal to happen, the preceding trend should be solid and steep;
There are a lot of candlestick patterns. The most famous are stars, harami, engulfing patterns, a hammer, and a hanging man. Most of them require confirmation in the form of a breakout of a significant level;
The signal of a pattern is stronger if this pattern consists of a cross (has a doji).
Coming up
In the next lesson, we will have a look at the patterns that show us the strength of a trend. They are called continuation patterns.