In the previous lessons of this course, we found out what Japanese candlesticks are and learned the most famous Japanese candlestick patterns. In the fourth lesson, we will examine the two strategies that require detective skills in recognizing and trading candlestick patterns!
Shooting Star Strategy
For the first strategy, let’s recall the shooting star pattern. Below, we provided an example of the “Shooting Star” pattern on the H4 chart of GE.
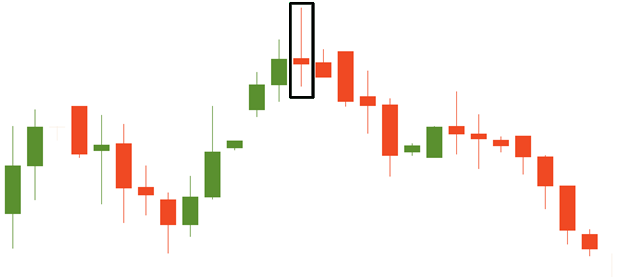
A classic Shooting Star:
Has a long upper shadow and a short lower shadow;
Has a small real body that should be located close to the low of the session;
Appears during the uptrend after the bullish candlestick. The signal is confirmed when the following big bearish candlestick closes below the close of the shooting star;
Can be either green or red.
If you still have trouble finding a “Shooting Star” pattern, you can check the second lesson of this course.
Now, let’s move to the trading algorithm of this strategy:
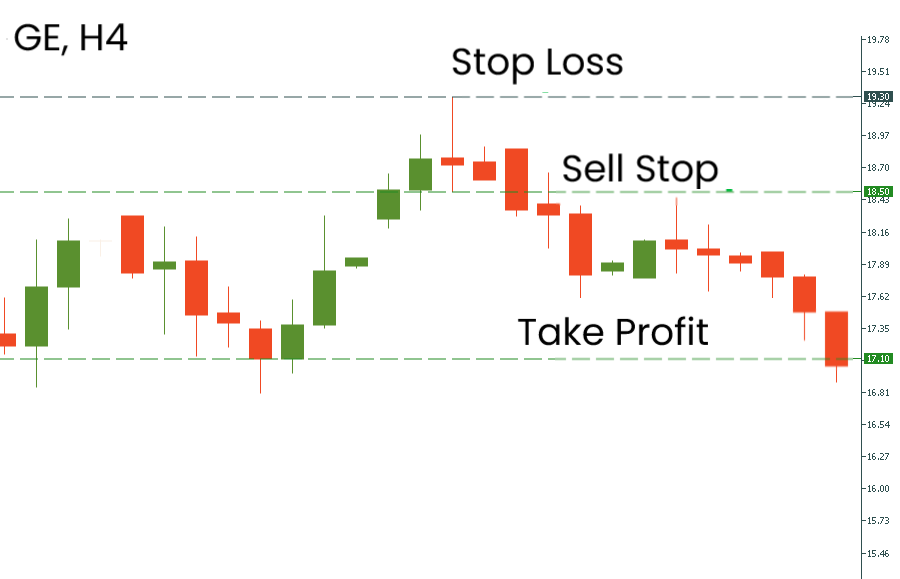
Wait for the Shooting Star to appear. Remember that the price should move within an uptrend;
Once you’ve noticed the formation of the shooting star, wait for the next candlestick to move below the low of the shooting star you’ve just found. You can use a Sell Stop order to place your entry precisely at the low of the Shooting Star;
Your Stop Loss should be located at the high of the Shooting Star;
Place Take Profit at the next significant support level.
We provided an example of this strategy below. On the H4 chart of General Electric, the Shooting Star pattern was formed. We placed a Sell Stop order at the low of the Shooting Star pattern at 18.50, Stop Loss was located at the high of that candlestick, and Take Profit was placed at the previous significant support of 17.10. This way, we would grab 140 points in one trade.
"How to avoid situations when the shooting star turns out to be fake?"
It's vital to wait for confirmation. The next candlestick after the “Shooting Star” should be bearish. Also, don’t forget about a Stop Loss! It protects you from unfortunate trades.
The next strategy is known as the “Third Candle” pattern. It may resemble the “Three Black Crows” or the “Three White Soldiers” patterns. The main difference between them is that the “Third Candle” pattern has fewer restrictions concerning the opening price of each candlestick.
The Third Candle Strategy
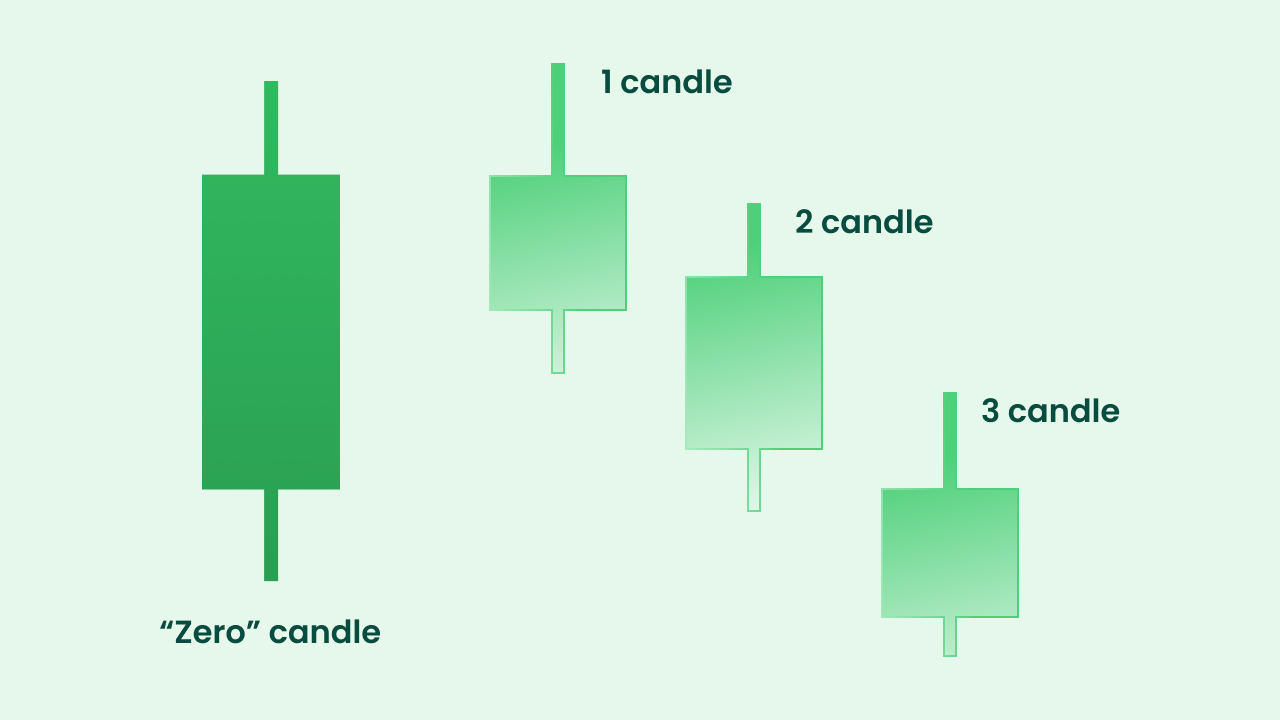
There are two types of this pattern: bullish and bearish. We will start with the bearish pattern.
This pattern's first candlestick is bullish (called the “zero” candlestick). The next candlestick should be bearish. The second bearish candle should confirm the downward momentum. The third candle is used for opening a short position.
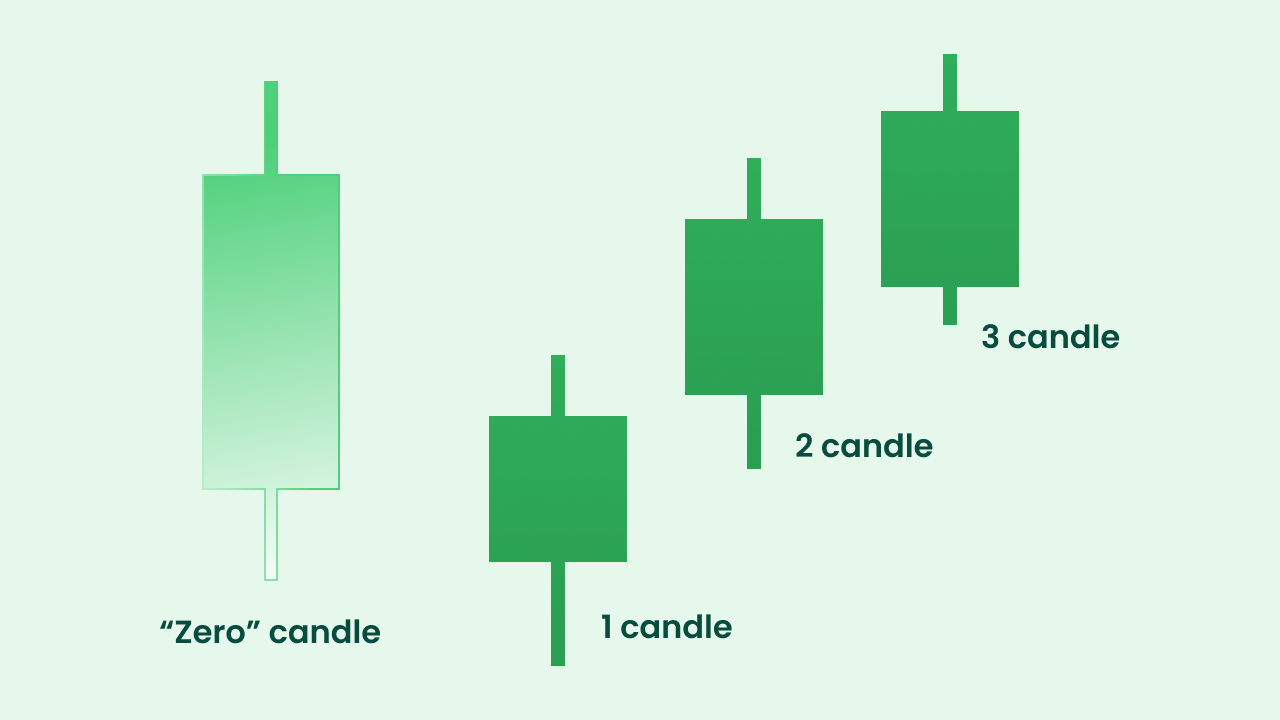
Vice versa, we identify the bullish pattern. The first bullish candlestick should appear after the bearish one (“zero”). It should have a lower low. The second bullish candlestick is used as a confirmation of the reversal to the upside. The opening price of the third candlestick is the level where we open a long position.
After identifying the “Third Candle” pattern, let’s consider the main steps of the strategy itself.
For a long position:
Wait for the complete implementation of the bullish “Third Candle” pattern. If the bodies of the first and second candles are tiny – you shouldn’t enter the market because it shows that bulls are losing their strength;
Secondly, attach the Stochastic oscillator to the chart. Its lines should move up;
If all conditions are met, enter a long position after the third candlestick opens;
Place Stop Loss below the low of the first candlestick;
Place a “Take Profit” level at the next significant resistance level.
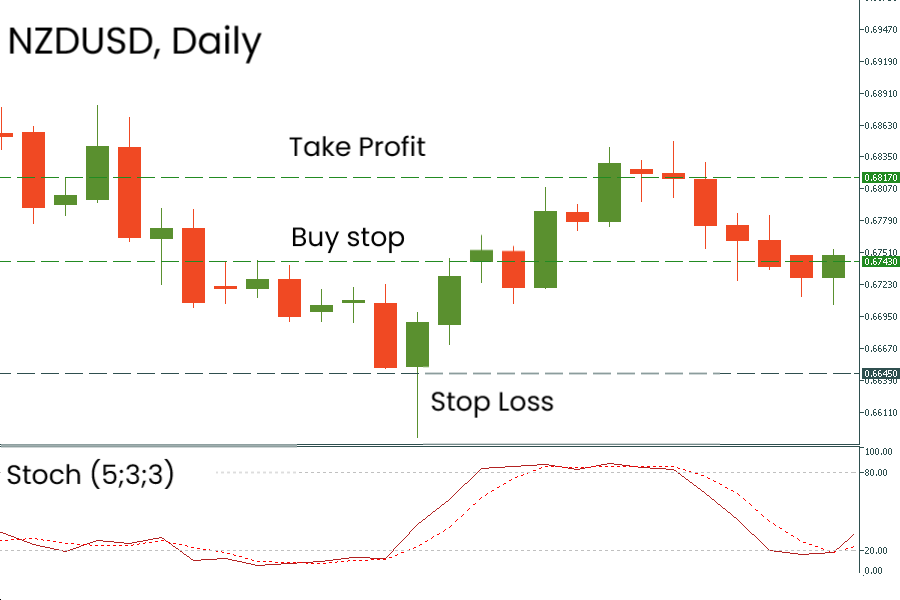
Have a look at the example below! On the daily chart of NZDUSD, the “Three Candles” pattern was implemented. After the third candle appeared, we confirmed the upside momentum with the Stochastic oscillator leaving the oversold zone and going higher. We placed a Buy Stop order at 0.6743. Stop Loss was placed below the low of the “zero” candlestick at 0.6645, and Take Profit was located at 0.6817, near the previous significant resistance. This way, we earned 740 points.
For a short position:
The scenario of opening a short position is similar to the one described above.
Wait for the bearish “Third candle” to be implemented. As with the long trade scenario, the bodies of the first and the second candles should not be small;
The Stochastic oscillator should go down;
Open a short position at the opening price of the third candlestick;
Place a Stop Loss above the high of the first candlestick;
Place a Take Profit order at the next significant support level.
Below we provided an example of the sell trade.
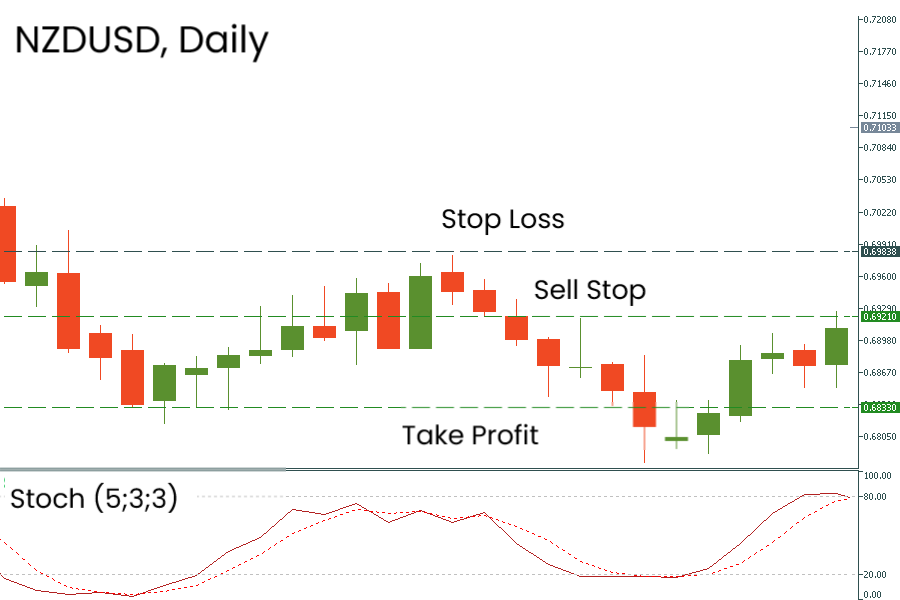
After the “Three Candle” pattern was implemented on the daily chart of NZDUSD, we waited for the Stochastic indicator to go down. We placed the Sell Stop order at the opening price of the third candlestick at 0.6921. The Stop Loss was located above the high of the first candlestick at 0.6983. As for the level of Take Profit, we situated it at the support level of 0.6833. As a result, we got 880 points of profit.
"Is it important to place Take Profit near the significant support and resistance levels for this strategy?"
The levels of support and resistance represent potential reversal zones. The price may move in the opposite direction when this target is reached. We recommend placing the level of Take Profit slightly below the closest resistance and above the closest support. Also, it is recommended to trail the level of Take Profit and close the position when you see signs of the reversal (a crossover of the Stochastic oscillator in the overbought/oversold zones, reversal candlestick patterns).
Now you know two of the most popular trading strategies requiring knowledge of Japanese candlestick patterns. Of course, there are much more of them! Don’t forget to practice trading with these strategies on a Demo account.
Lesson summary
The Shooting Star strategy is viral among traders, as this pattern is a regular guest on the charts;
The Shooting Star pattern appears at the end of an uptrend. Confirmation in the form of a bearish candlestick is required;
The main difference between the “Three black crows” and the “Third candle” pattern is that the latter has fewer restrictions concerning the opening price of each candlestick;
The “Third Candle” strategy requires a Stochastic oscillator to confirm the momentum.