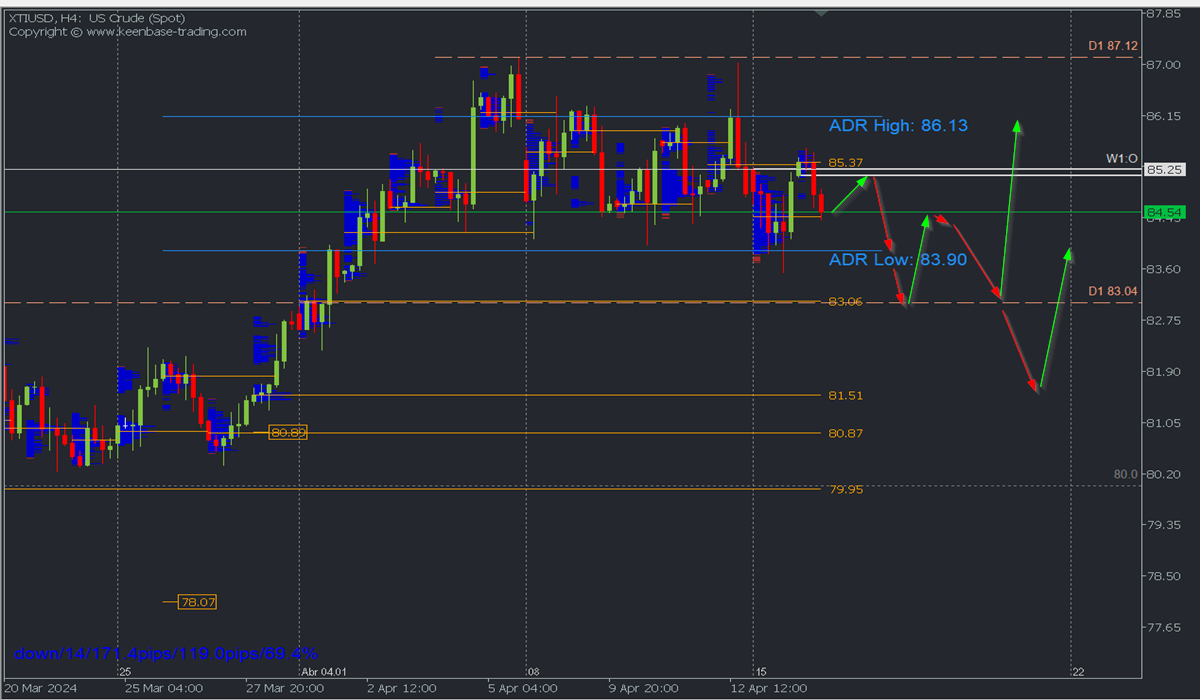
- Bearish scenario after bullish retracement: Sales below 85.20 with TP1: 84.12, TP2: 83.52, and TP3: 83.05 with S.L. above 85.61 or at least 1% of account capital.
Bullish scenario after descent: Buys above 83.00 with TP: 85.61, TP2: 186.50, and TP3: 87.12, with S.L. below 82.80 or at least 1% of account capital. Apply trailing stop.
Fundamental Outlook
The rapid escalation of the conflict between Israel and the Hamas group occurred following Iran's weekend attack on Israel, with a wave of missiles and drones that were mostly countered. However, calls for calm from major leaders and indications that the U.S. would not participate in an Israeli counteroffensive against Iran helped prevent crude oil prices from opening the week with a bullish gap or extending the bullish trend in the following hours, despite expectations that the Israeli offensive will not be delayed for long.
This geopolitical context adds to other price drivers such as expectations of higher inflation contributing to delaying monetary easing (lowering interest rates) by the Fed, corporate earnings season, crude inventories, and news about Chinese demand, to establish a balance, which for now seems to be focused on geopolitics.
Any news of a new escalation in the Israel conflict will limit the advancement of the correction in favour of a rapid price increase.
Scenario from H4 chart:

The pair is within a bullish trend with the last resistance at 87.12 and has been undergoing a bearish correction since last week. This could extend as long as prices remain below the weekly opening at 85.25 and the previous supply zone between 85.37 and 85.70.
Likewise, the demand zone around 84.20 has been preventing a more decisive price decline, so long lower wicks are observed, however, the breakout of yesterday's POC at 84.46 will pave the way for further decline towards 84.14, a high-volume node and possibly the daily bearish average range at 83.90, paving the way to extend the decline in the coming days towards 83.52 and 83.04, where the next demand zone and the broken resistance from March now act as support.
The creation of support below 83.52 in the current correction will validate today's high at 85.61 as the last relevant resistance of the bearish correction. It will serve as a reference for price reversal.
The bullish renewal will occur after a strong reaction to a demand zone and the subsequent breakout of the last relevant resistance that the price leaves behind, which under the current scenario is last week's resistance at 87.02 (Not marked as it is very close to the resistance at 87.12 and the current April high).
*Uncovered POC: POC = Point of Control: It is the level or zone where the highest volume concentration occurred. If there was previously a downward movement from it, it is considered a sales zone and forms a resistance zone. On the contrary, if there was previously an upward impulse, it is viewed as a buying zone, usually located at lows, thus forming support zones.
Disclosure
This analysis does not constitute investment advice or an offer to engage in financial transactions. Although every investment carries risks, trading in currencies and other leveraged assets can involve significant losses. A complete understanding of the risks before investing is recommended.
@2x.png?quality=90)


