- Bearish Scenario: Sell below 77.50/77.81 with TP1: 77.36, TP2: 76.91, TP3: 76.26, and TP4: 76.00, with S.L. above 78.53 or at least 1% of account capital.
- Bullish Scenario: Buy above 78.70 with TP1: 79.00 and TP2: 79.90, with S.L. below 78.00 or at least 1% of account capital. Apply trailing stop.
Fundamental Analysis:
The price of crude oil marked a significant drop on Wednesday following a substantial increase in crude inventories reported by the U.S. International Energy Agency (IEA) after hitting a key selling zone on May 30.
Subsequently, in a recent report, the IEA indicated that it believes oil demand will peak in early 2029 at around 106 million bpd, after projecting a peak for 2030. This report was supported by a similar one published by OPEC, which led to a recovery in prices on Thursday, a move that was almost completely discounted shortly after.
This optimism is supported by the seasonality of crude oil, where the summer months tend to be bullish due to increased fuel demand driven by higher travel and tourism.
However, there is still a bearish price trend, given the current higher supply, with countries like Russia reporting that their oil production in May exceeded the quotas agreed upon by the OPEC+ alliance.
Additionally, after the Fed left a perspective of higher rates for a longer period with just one rate cut, it is inferred that higher interest rates hinder economic growth, which in turn negatively impacts oil demand, a current driver that can keep prices under pressure.
Technical Analysis:
XTIUSD
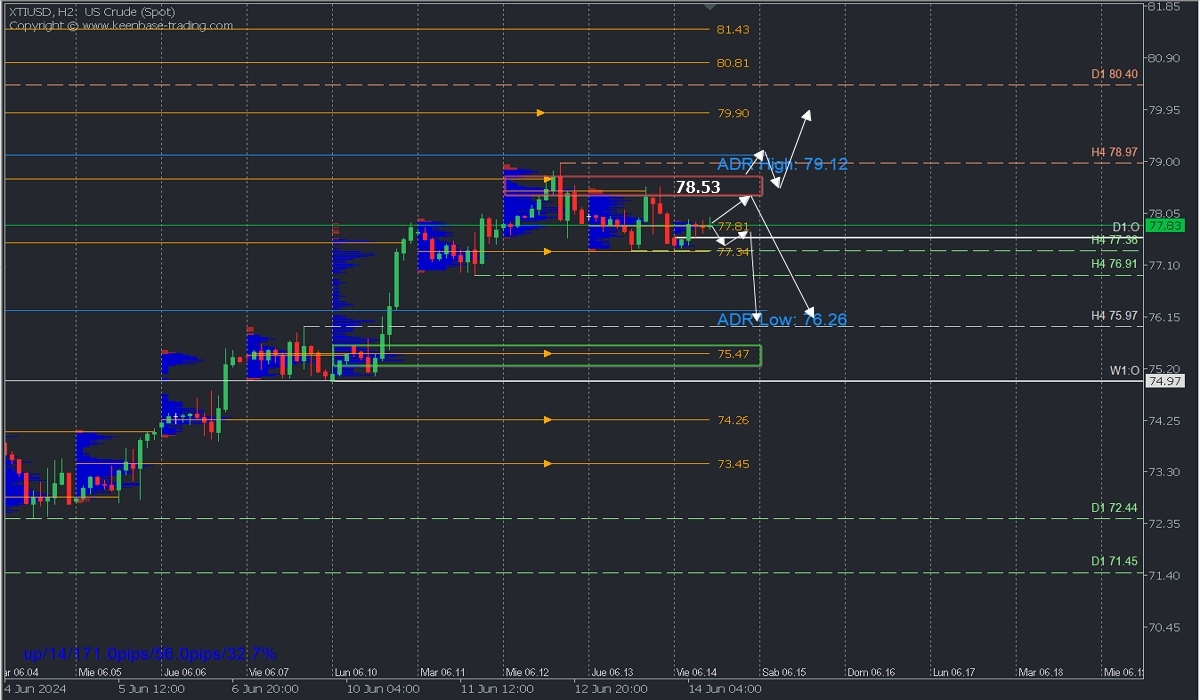
- Average Daily Range High (ADR High): 79.12
- Average Daily Range Low (ADR Low): 76.26
- Supply Zones (Sells): 78.46
- Demand Zones (Buys): 77.34
The price rally shows signs of exhaustion after forming a failure below the 78.97 resistance and creating a supply zone between 78.53 and 78.68, where the price is expected to rise to seek liquidity during the European morning before a new price decline is anticipated.
The continuation of the bearish price trend should follow two basic patterns:
1. Stay below the indicated supply zone marked with a red rectangle.
2. Decisively break, at least on a second touch, the demand zone around 77.34, opening the possibility to continue bearish towards 76.91 and the average daily range low at 76.26 intraday, the support at 75.97, and the demand zone around 75.47.
The anticipated bearish scenario will activate with the price below 77.81, the POC of the early sessions, and the break of the 77.36 support.
This scenario will be invalidated if the quotations decisively break the supply zone around 78.53, indicating a bullish continuation towards 79.00 and more extended to the supply zone at 79.90.
*Uncovered POC (Point of Control): POC = Point of Control: This is the level or zone where the highest volume concentration occurred. If there was a prior bearish movement from it, it is considered a sell zone and forms a resistance zone. Conversely, if there was a prior bullish movement, it is considered a buy zone, usually located at lows, thus forming support zones.
@2x.png?quality=90)