Canada and Germany have recently experienced the highest inflation in 40 years, highlighting three key lessons for Canada. First, the importance of the supply side of the economy was underscored, as supply shocks can persist and intersect with strong demand, causing significant inflation. Second, the pain of inflation was felt widely, harming people and the economy, and eroding trust in the market system. Third, central bank credibility and public trust are crucial; maintaining and restoring this trust requires effective communication and delivery on monetary goals. Currently, the Bank of Canada has cut its policy interest rate to 4.75% as inflation eases, indicating that monetary policy can be less restrictive.
EURCAD – H2 Timeframe
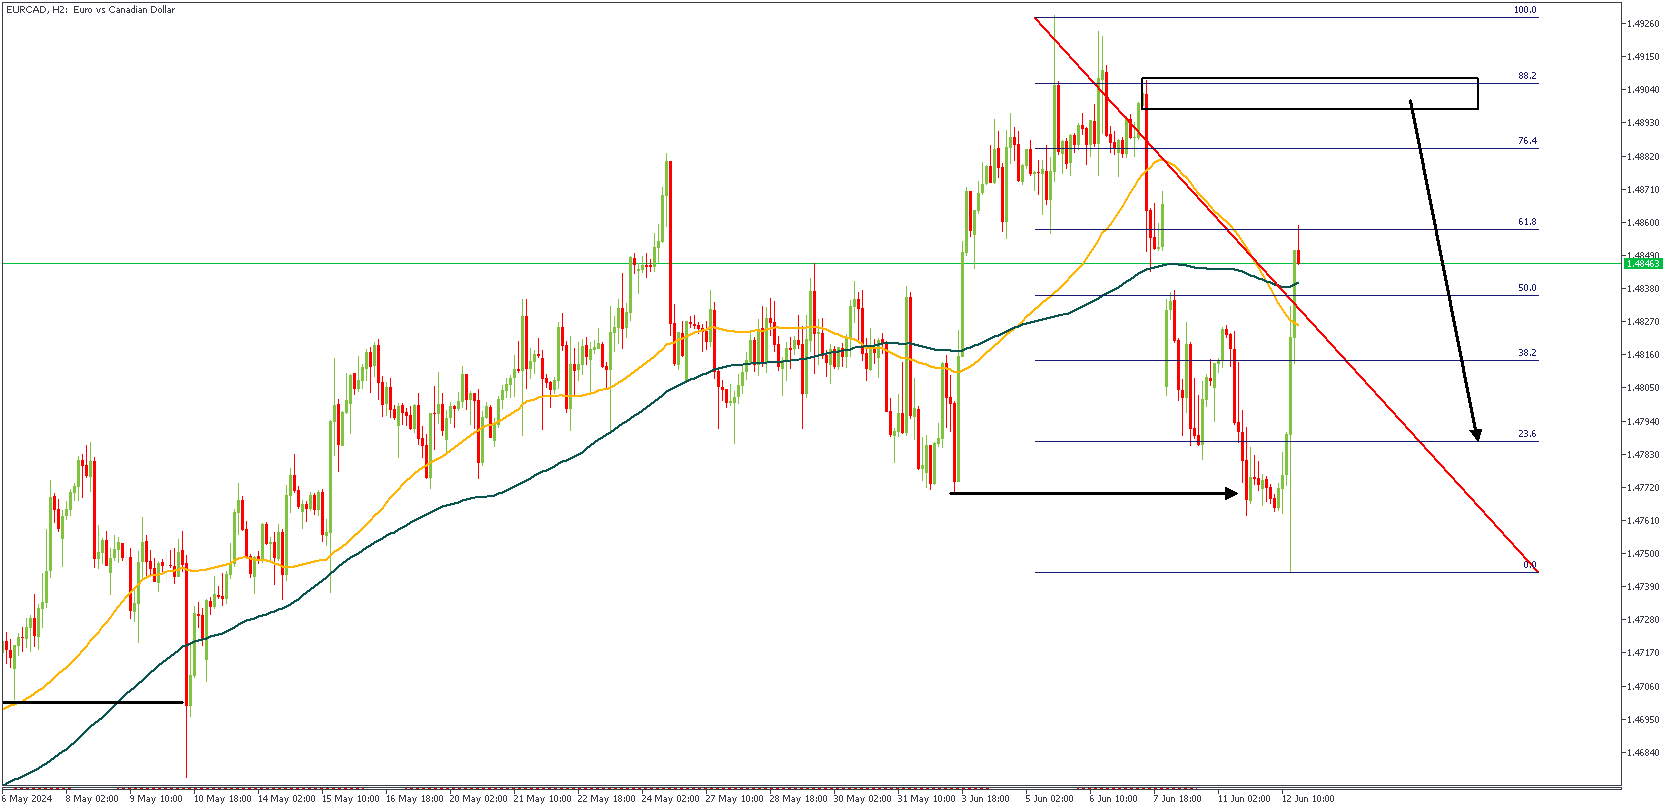
The 2-hour timeframe chart of EURCAD shows the recent break of structure as highlighted by the horizontal arrowhead. The swing has been marked with the Fibonacci retracement tool to provide clear points of reversal that could be considered as entries. The overlying supply zone serves as an added confluence for the bearish sentiment.
Analyst’s Expectations:
Direction: Bearish
Target: 1.47153
Invalidation: 1.50603
GBPCAD – W1 Timeframe
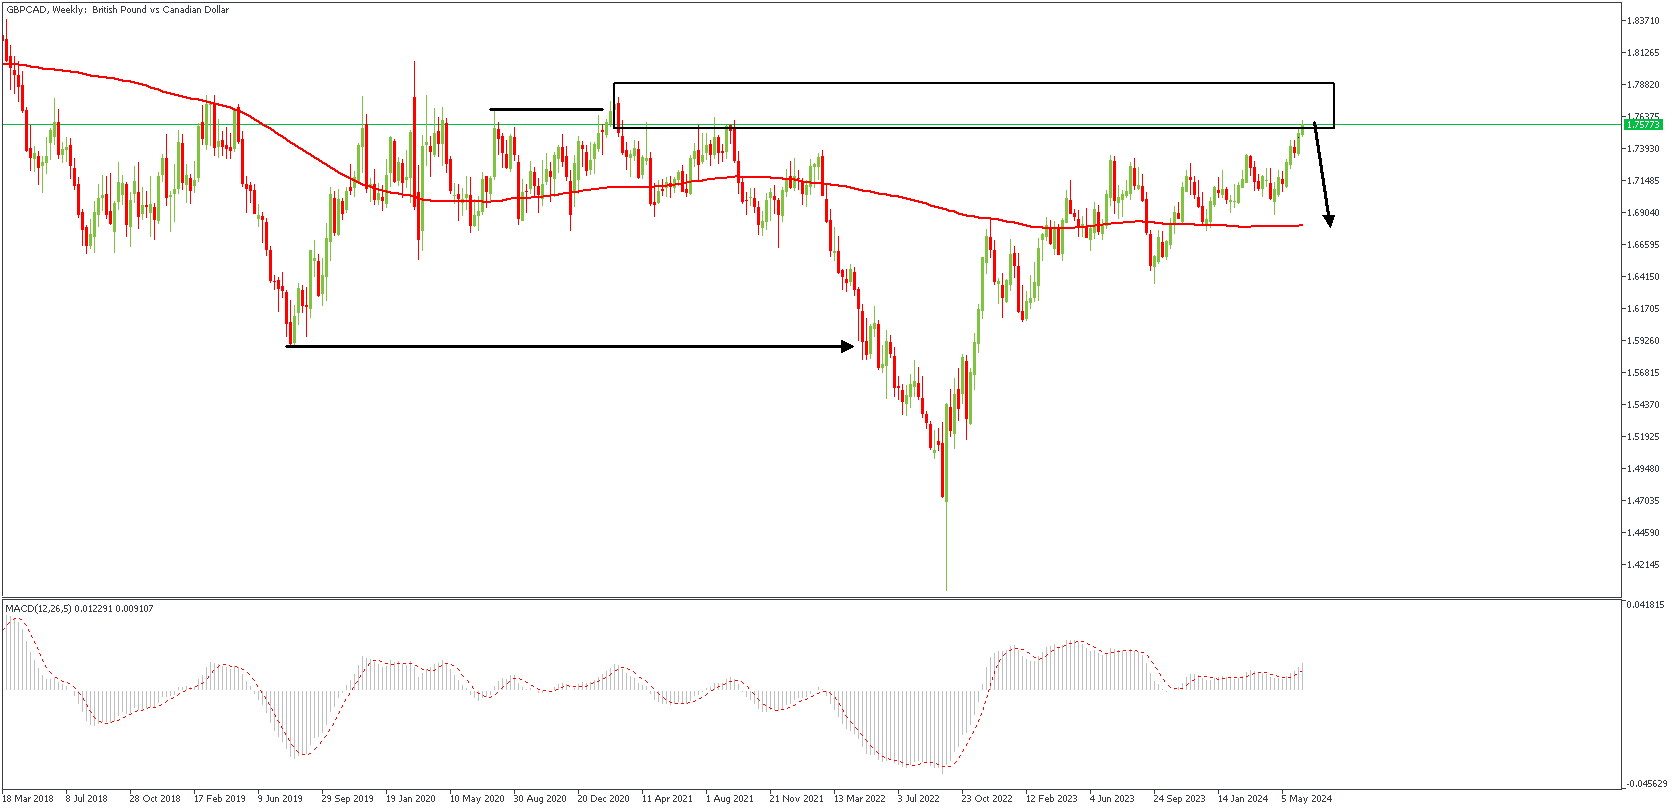
GBPCAD on the weekly timeframe can be seen to have swept liquidity from the previous high marked by the horizontal arrowhead, following which price has also broken below the previous low. These factors point to the likelihood of a bearish sentiment, which can be further confirmed by the reaction of price from the lower timeframes.
Analyst’s Expectations:
Direction: Bearish
Target: 1.72498
Invalidation: 1.79139
NZDCAD – W1 Timeframe
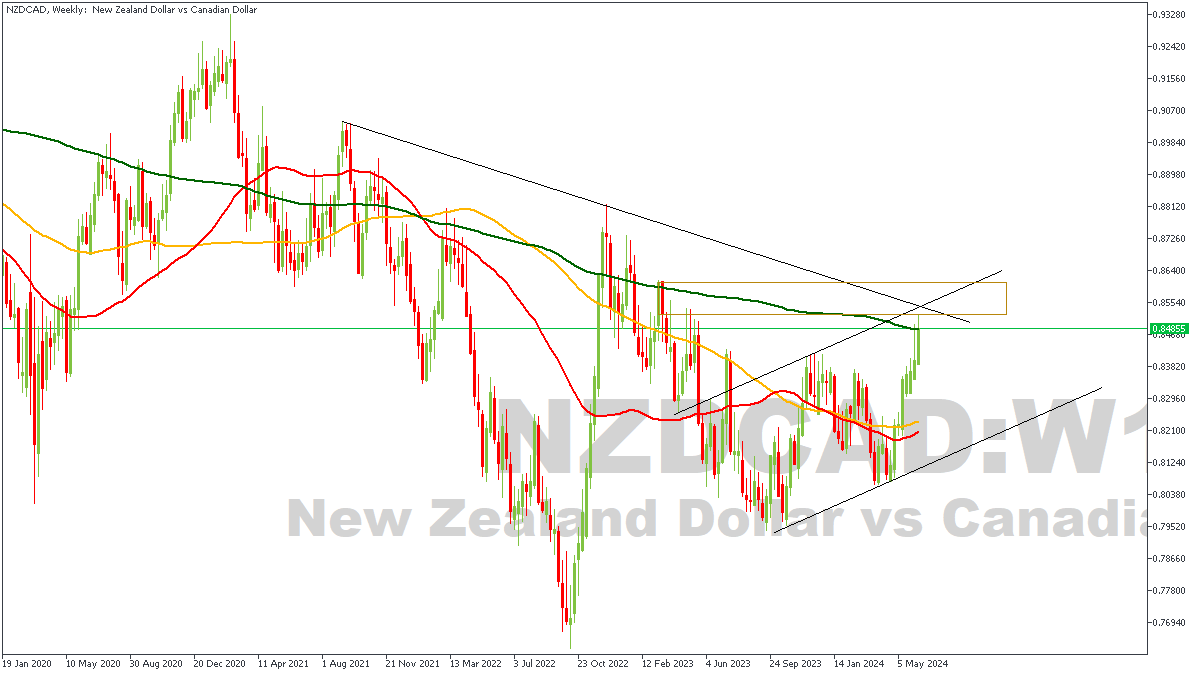
The weekly timeframe of NZDCAD shows price trading within a rising channel as it approaches a key area of supply. There is also a trendline resistance that intertwines with the 200-period moving average and the weekly supply zone. On this basis, my bearish sentiment can be considered definite.
Analyst’s Expectations:
Direction: Bearish
Target: 0.82981
Invalidation: 0.86068
CONCLUSION
The trading of CFDs comes at a risk. Thus, to succeed, you have to manage risks properly. To avoid costly mistakes while you look to trade these opportunities, be sure to do your due diligence and manage your risk appropriately.
You can access more of such trade ideas and prompt market updates on the telegram channel.


