Trend trading tips by Victor Sperandeo
We are sure that you are familiar with technical analysis and trend lines in particular. In this case, you know that the trend-building carries a lot of subjectivity involved. Today we will explain to you the methods of trend-constructing and trend-trading by famous trader Victor Sperandeo, also known as “Trader Vic”. Together with Mr. Sperandeo, we will learn how to make trendlines work for you.
Who is Victor Sperandeo?
Trader Vic is a US trader, index developer, and financial commentator. He is known for trading commodities in the energy and metals sectors. An interesting fact: he predicted the stock market crash of 1987 (Black Monday). Before the crash, Victor Sperandeo shorted the Dow index and made 300% during a day.
The outstanding trading abilities of trader Vic helped him to create many useful and profitable strategies and techniques, which are relevant until now. The famous trendline method that we are going to explain to you below is one of them.
The trend-trading method by Trader Vic
Let’s consider the very simple method for trend trading described by Mr. Sperandeo. It is called “changing trends in the one-two-three”. Of course, it starts with the construction of a correct trendline.
From the basics of technical analysis, you remember that you need to draw a line between at least two points. If you consider an uptrend, you see a series of higher highs and higher lows. Alternatively, a downtrend is a series of lower lows and lower highs.
So, you opened a chart in MT4, and faced with the first problem: there are too many lines that you can potentially consider as “trendlines”. But which one of them is the right one? Let’s look at the algorithm of determining a good working trend by Trader Vic.
- For an uptrend, a line from the lowest low to the highest minor low should be drawn, which is followed by the highest high. The line should not pass through prices between the two points. However, the line may cross the price after the highest minor high. It signals the change of the trend.
- For a downtrend, you need to draw a line from the highest high to the lowest minor high followed by the lowest low. As with a downtrend, the line between these two points should not cross the price.
Let’s look at the step-by-step representations. Firstly, we will start with building an uptrend.
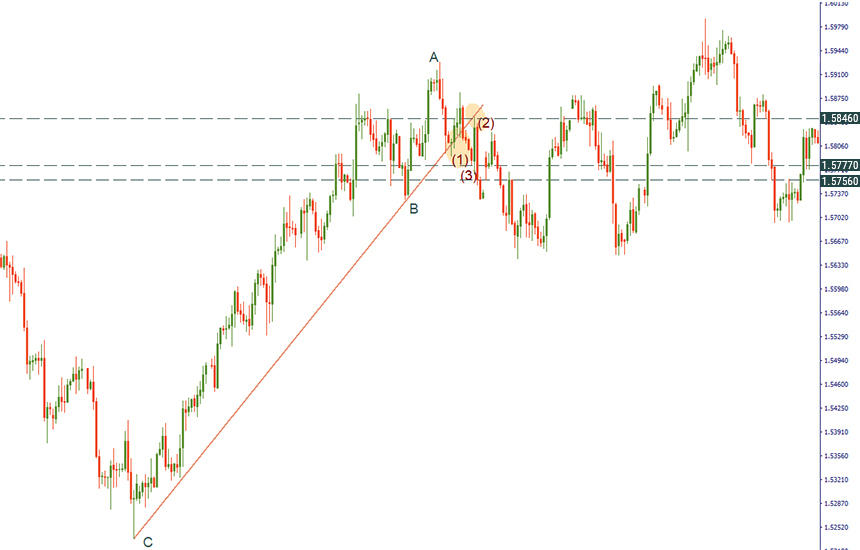
- To begin with, we need to find the highest high (A) on the chart and a significant minimum (B), which lies close to this high.
- Then, we look for the lowest minimum (C) and connect the points “B” and “C”. If the price crosses the line, we move the point “C” until the line won’t touch the price.
The uptrend is established. So, what should you do next? Let’s look at the picture below to understand the “one-two-three” method by Victor Sperandeo.
We can see an uptrend formed on the 4-hour chart of GBP/USD. After passing the “A” point, the trendline touched the price. It signaled about the change of a trend. The breakout of the trendline to the downside is called “one” (1) by trader Vic. After that, the price rises and retests the trendline. This is second (2) necessary condition of the reversal. At the same time, the low before the candlestick which caused a retest is considered as a level which needs to be broken to confirm the reversal. Thus, the break of the 1.5777 level is the third condition (3), after which we may open a short position. In our example, we opened a short position at the closing price of a candlestick after point (3) at 1.5756. Stop loss will be placed at the point (2), but the level of take profit needs to be trailed.
Now, let’s look at the scenario with a downward trend.
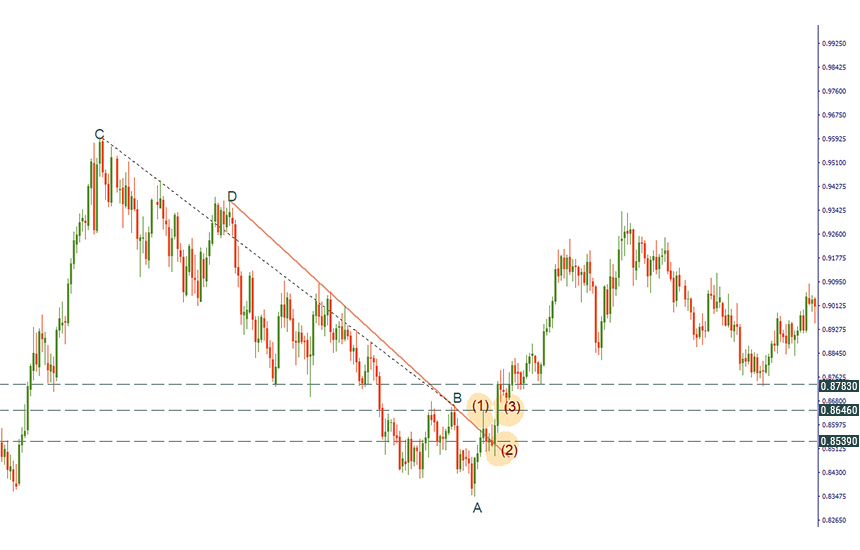
- Here, we need to find the lowest low on the chart (A) and a significant maximum (B).
- After that, we look for the highest high (C) and connect the points “B” and “C”. From the example below, we can see that the line crosses the price several times. That is why we need to move the point “C” to the lower extremum. After drawing a trendline between the points “D” and “B”, the trendline does not cross with the price. So, the formed trendline is supposed to be the correct one.
Now we are ready for some trend trading! After the price crossed the trendline (1st condition), we wait for the retest of the trendline. The high before the candlestick which caused a retest is considered as a level which needs to be broken to confirm the reversal. That means, the break of the 0.8646 level is the third condition (3), which may be considered as a signal to open a long position. On the picture below, we opened a position at the closing price of the candlestick after point (3) at 0.8738. Stop loss will be placed at the closing price of the candlestick, which caused a breakout at 0.8539. As for the level of take profit, we trail it.
Conclusion
Today we learned some tips on trend-construction and trading by the famous Trader Vic. Although the strategy seems easy, it requires practice and the knowledge of the basics of technical analysis.