Imbalance Trading Strategy
This article introduces you to a trading strategy that doesn’t require volumes, technical indicators, and price patterns. All you need to do is to be attentive to the price action. Welcome to the Imbalance tutorial.
The concept behind the strategy
How to understand when to enter the trade? We may look at an RSI indicator, Stochastic data, MAs, or something else. Each indicator has a place in the world and may work under certain conditions. But there is a way of analysis that excludes technical indicators and price patterns like double tops, heads with shoulders, and wedges. This method of analysis uses a different approach.
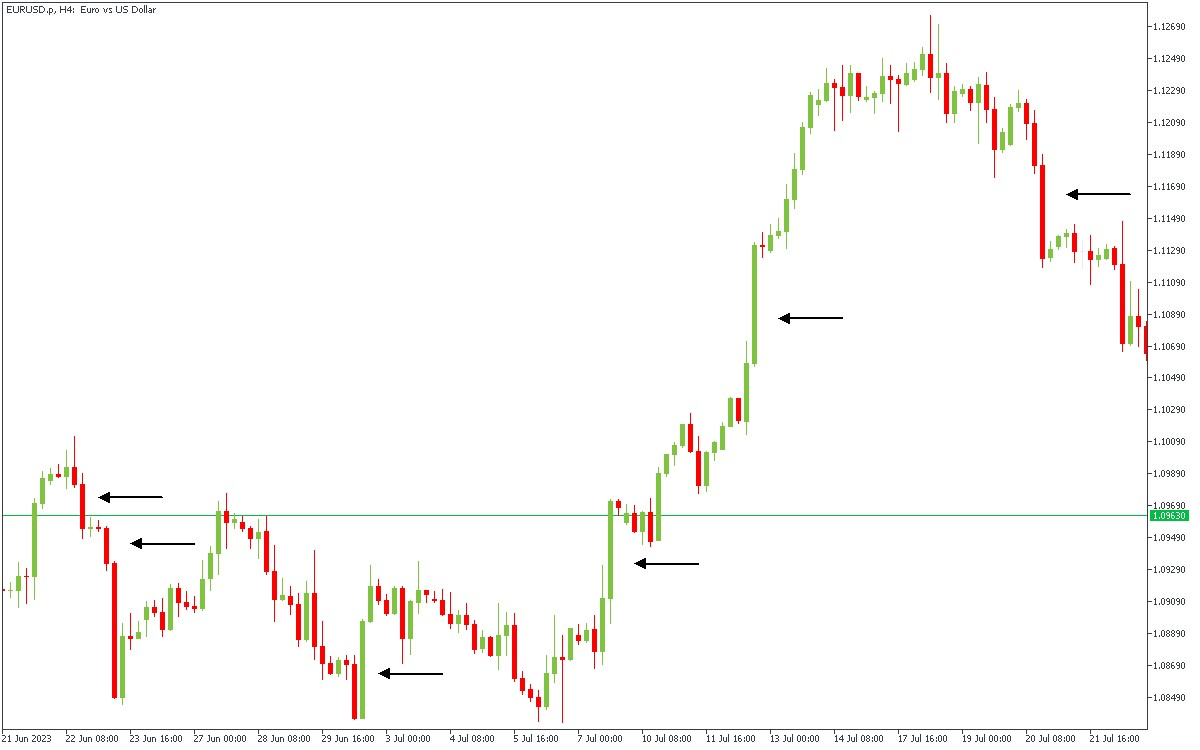
Traders call it the Smart Money Concept (SMC). It’s a market analysis method based on the big players' probable actions: banks, institutional investors, whales, market makers, and insiders. When a huge player wants to enter the game, it creates unusual price fluctuations because the big player moves the market because their orders are insanely large. Usually, the price starts to move quite fast, creating big long candles with relatively small wicks, like in the chart below.
What is the imbalance?
In the picture above, the spaces that we marked with arrows are called an imbalance. Another name is more complicated: a fair value gap (FVG). You may find it all across different charts, from Forex and gold to crypto and stocks (although stocks have way more gaps because stock trading is time-barred).
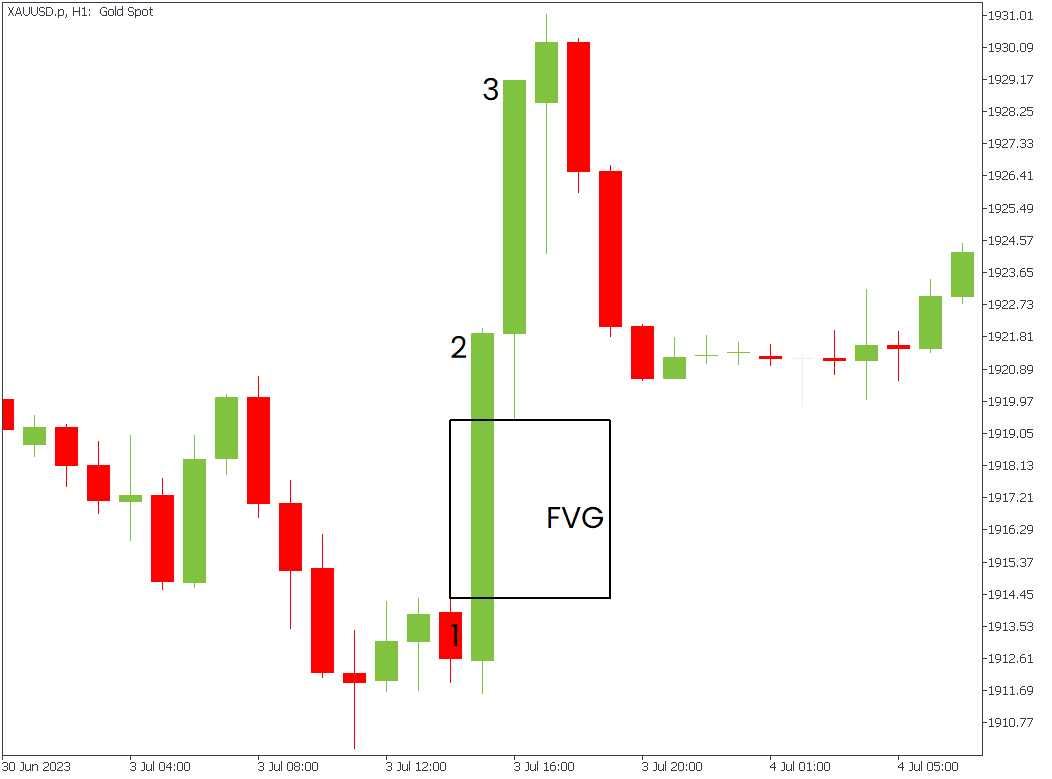
Imbalance consists of three candles. The second candle is an impulse in any direction. The first and the third candles create the border of the imbalance. The imbalance has formed after the third candle closes.
The imbalance is located between the first candle's highest point and the third candle's lowest point (bullish imbalance).
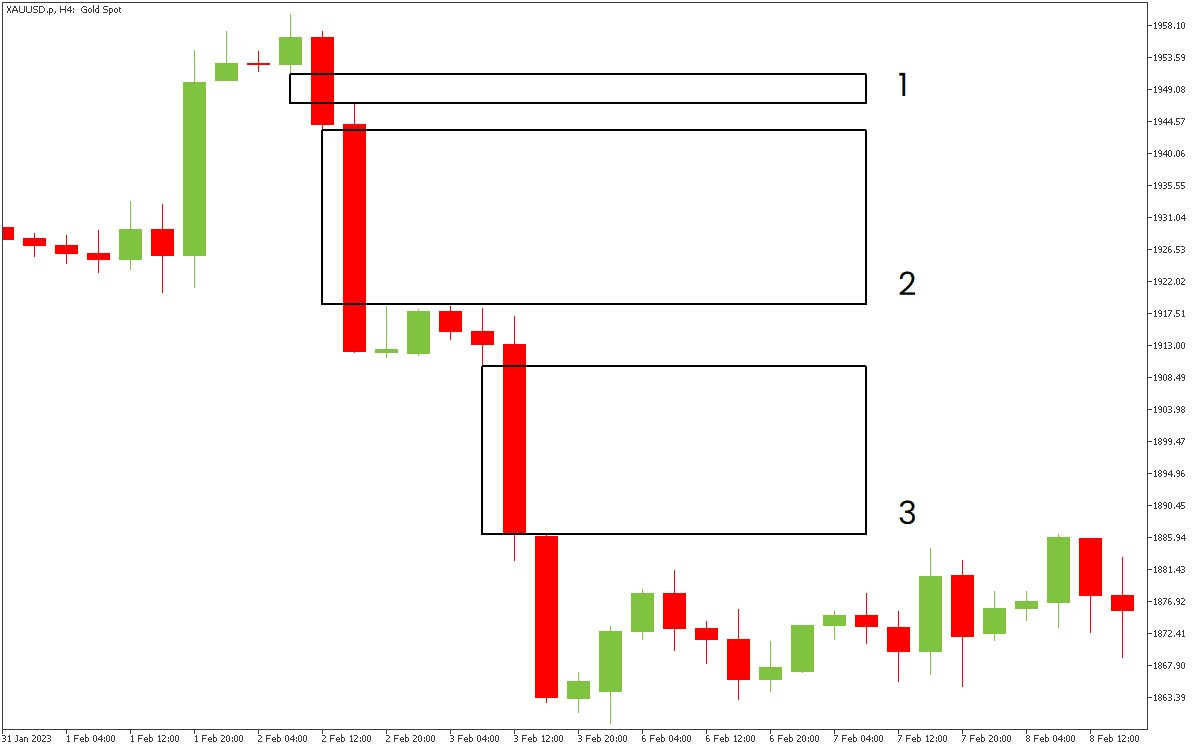
All three black rectangles on the chart below are bearish imbalances. It’s a space between the first candle’s lowest point and the third candle’s highest point. It’s part of the middle candle that isn’t touched by the neighboring candles.
We consider the imbalance strong when the price collected liquidity above the recent highs or below the recent lows before creating an imbalance. The basic rules for entering the trade are the following:
Rules for long entries
There are two options for long entries:
- On the trend’s reversal;
- After a correction of the trend.
Both options work the same way with minor differences. You need to know that trend reversal may be harder to catch because the market works, so the price will likely move in the direction of the trend.
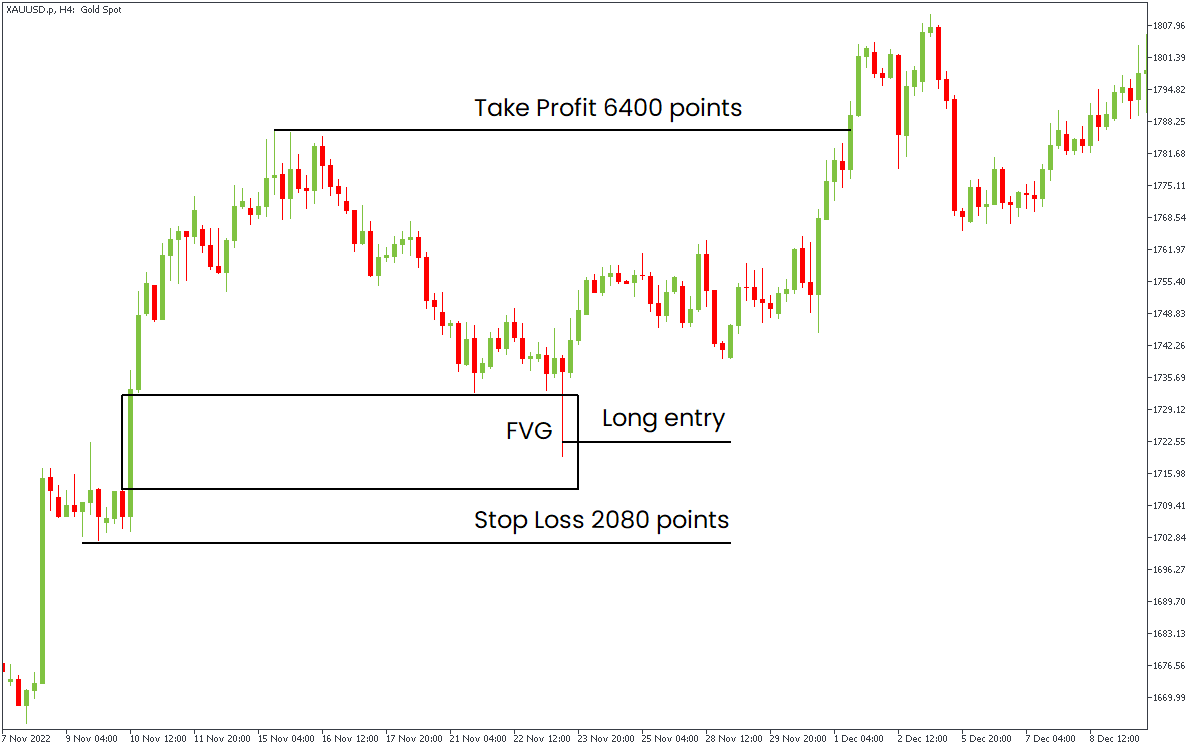
This example focuses on trend correction, and the next one is about trend reversal. Wait for the price to go higher with strong momentum (fast movement), leaving an FVG behind. It’s better if the price collects a liquidity pool before moving higher.
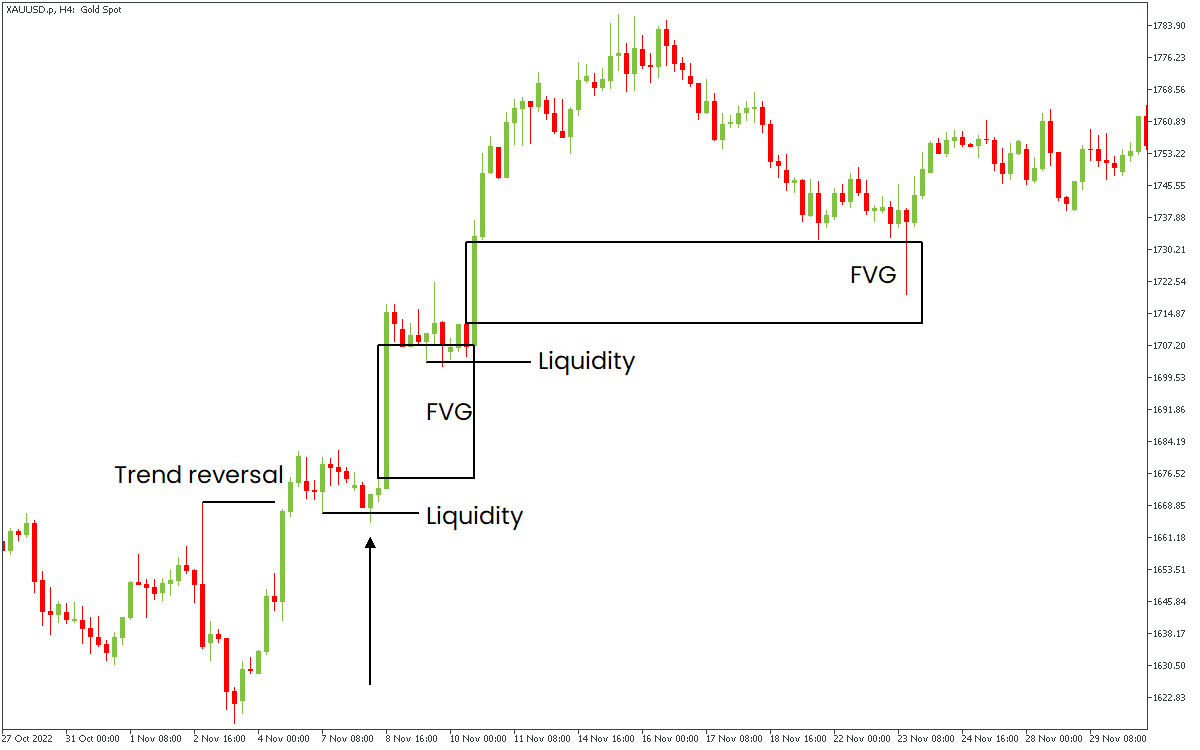
All we need to do is to wait for the price to go deeper into the FVG and open a long trade. The Stop Loss should be below the last swing low. The Take Profit should be above the recent high. It’s important to maintain a decent RR ratio (risk-reward). If you have a 1:3 RR ratio, you’re all set. A lower reward usually means it's wiser to skip the trade.
In the example below, we open a trade in the middle of the FVG from the upper chart to get the 1:3 RR ratio.
Rules for short entries
There are two options for short entries:
- On the trend’s reversal;
- After a correction of the trend.
Both options work the same way with minor differences. You need to know that trend reversal may be harder to catch because the market works, so the price will likely move in the direction of the trend.
To enter the trade, wait for the price to sweep the closest liquidity pool and reverse, leaving the FVG behind, as on the chart below.
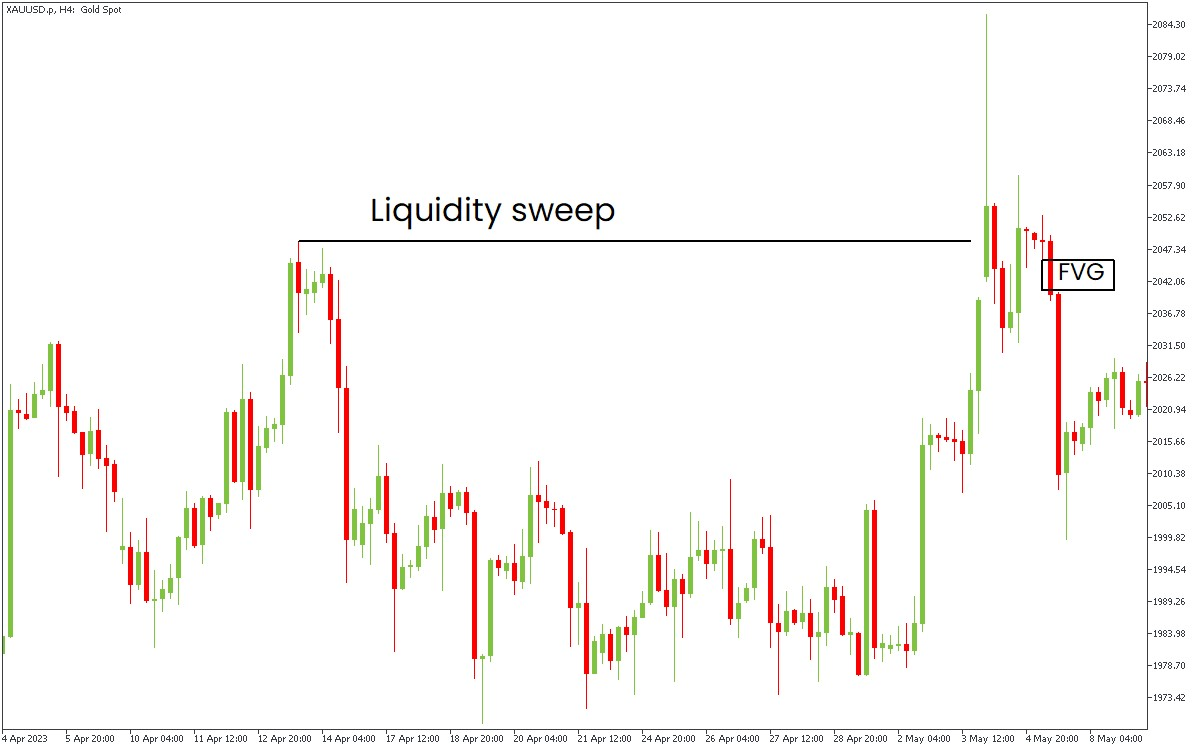
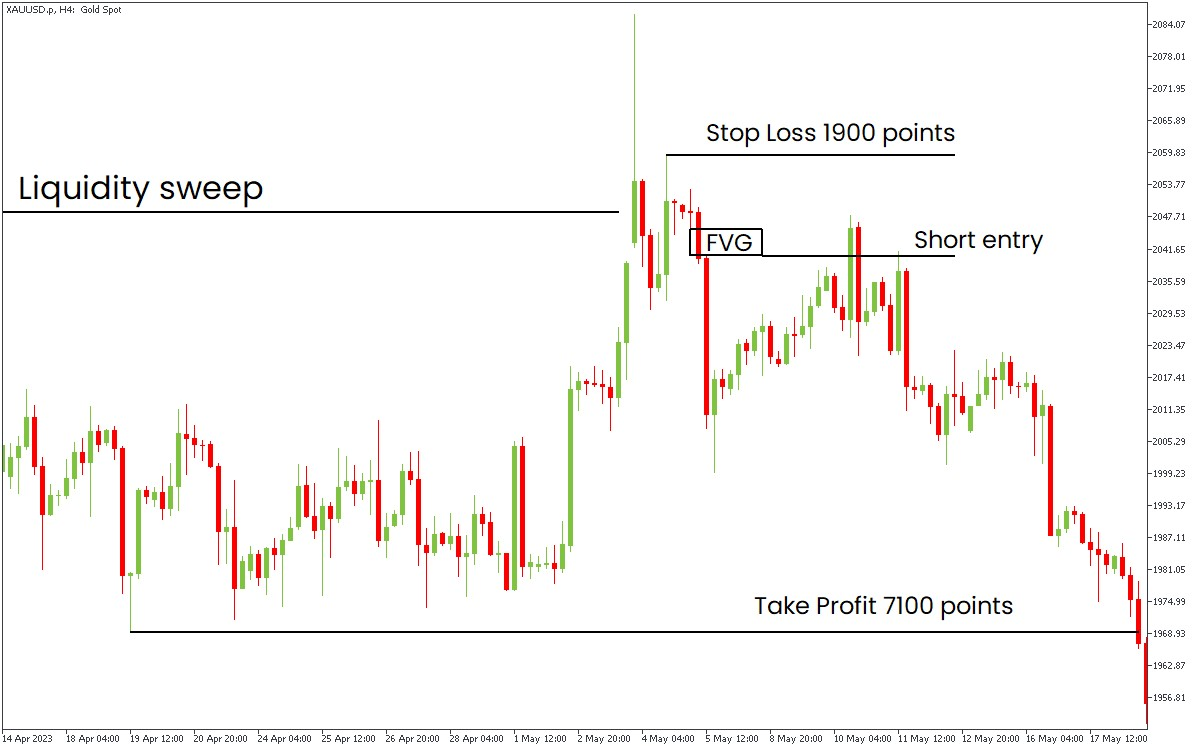
After that, wait for the price to reach the FVG. You may enter the trade as soon as the price touches the imbalance or wait for it to fill the whole gap. Rely on your risk management in deciding. If your RR (risk-reward) ratio is at least 1:3, then enter the trade. In another case, skip the entry.
Your Stop Loss should be above the recent high. Your Take Profit should be near the liquidity pool (support levels for short entries). You can also put your Take Profit at the lower FVG, as it’s also a price magnet.
Important things to keep in mind
This strategy is about waiting for the price to make several critical steps:
- Collect liquidity;
- Make an impulse, creating the FVG;
- Returning to the FVG.
Only in that case, we may enter the trade. On the other hand, the RR ratio is usually quite good, and you will have a lot of trade entries with this strategy.
Learn. Trade. Repeat.