DeMarker System Strategy
Introduction
The DeMarker Indicator was invented and described by Thomas DeMark.
The basic principle is the following: the intraday high of the current day is compared to the intraday high of the previous day. If the intraday maximum of the current day is higher, the corresponding difference is registered. A zero value is recorded if the intraday maximum is less than or equal to the previous day's intraday maximum. Then the differences obtained in this way are summarized. This value becomes the numerator of the indicator, which is divided by the same value plus the sum of differences between the price minima of the previous and current days.
When the indicator is below its lower level – the price may reverse UP. When the indicator is above its upper level – the price may reverse DOWN.
Strategy Setups
Instruments: any
Indicators: DeMarker, Parabolic SAR
Settings: change the levels of DeMarker to 0.2 and 0.8.
Timeframe: >30M
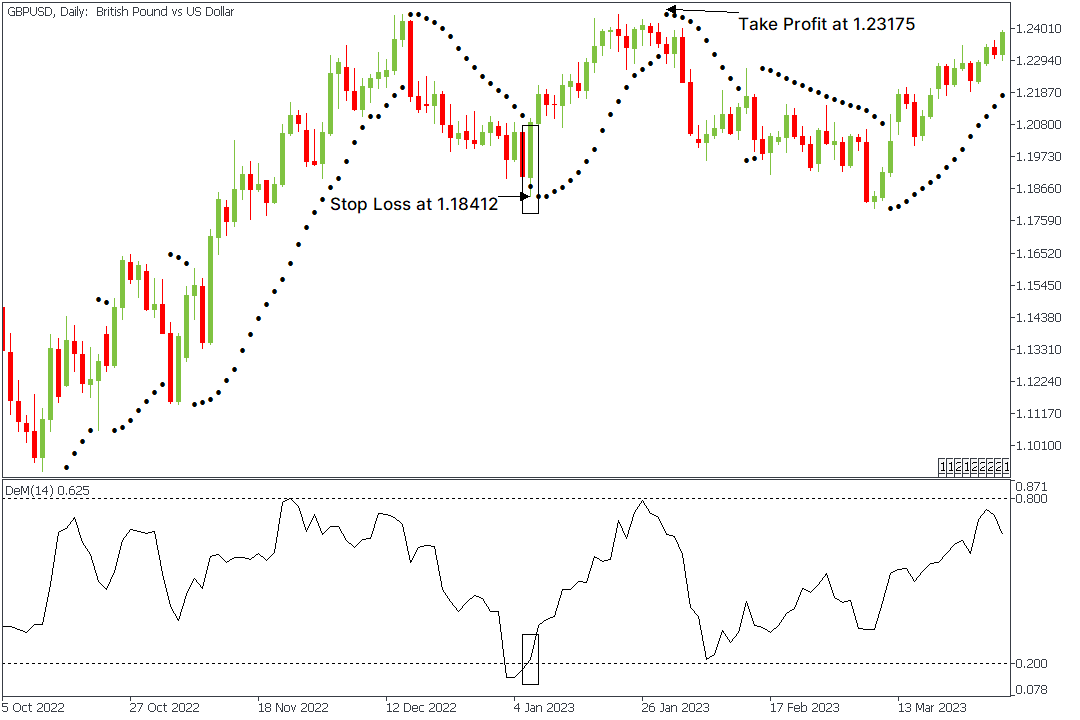
Rules for a Long Entry
- Wait for the DeMarker line to break its LOWER line and returns back to the working zone
- Parabolic SAR should start rising, or at least should form the last point at the bearish trend
It is recommended to use the Stop Loss at the level of the nearest local minimum before receiving the signal.
For example, we open a long position in GDPUSD at 1.20880 when the Parabolic SAR indicator starts moving UP, and simultaneously, the DeMarker line crosses its lower line. Stop Loss is at the lowest low – at 1.18412.
We kept holding a trade until Parabolic SAR changed its direction and started falling – at 1.23175.
We made 2295 points of profit.
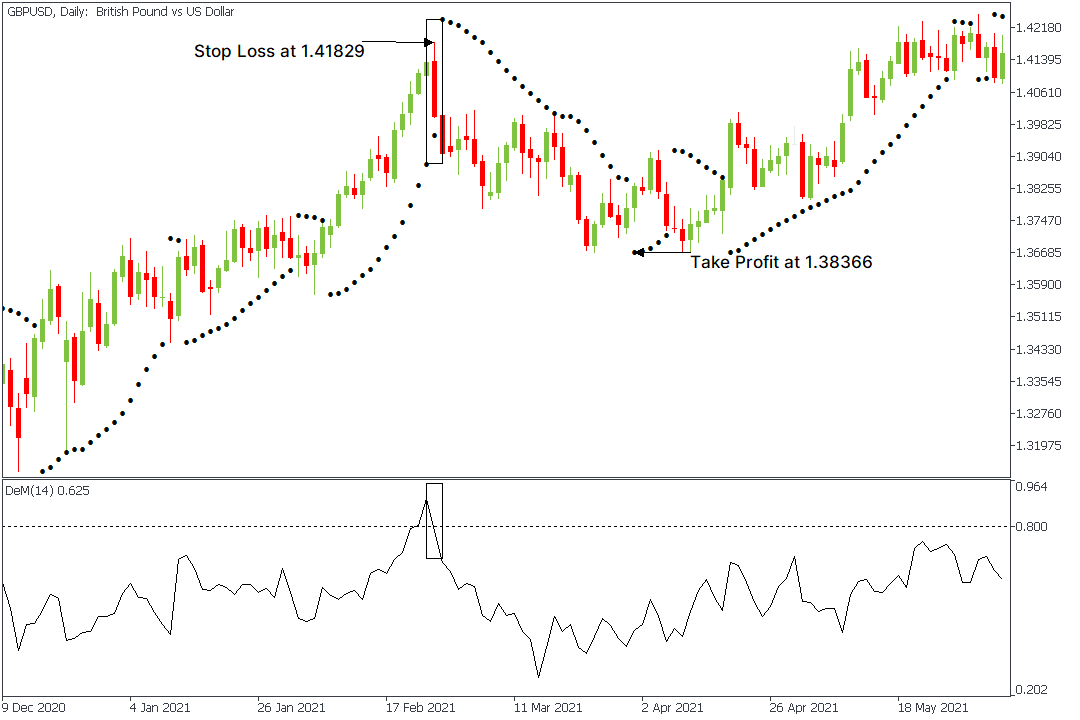
Rules for a Short Entry
- Wait for the DeMarker line to break its UPPER line and returns back to the working zone
- Parabolic SAR should start falling, or at least should form the last point at the bullish trend
It is recommended to use the Stop Loss at the level of the nearest local maximum before receiving the signal.
We open a short position in GDPUSD at 1.40013 when the Parabolic SAR indicator starts moving DOWN, and simultaneously, the DeMarker line crosses its upper line. Stop Loss is at the highest high– at 1.41829.
We kept holding a trade until Parabolic SAR changed its direction and started rising – at 1.38366.
We made 1647 points of profit.
Rules for a Take Profit level
The choice of Take Profit is possible based on the ratio 3:1, i.e. trade should bring 3 points of profit for one lost profit point.
Another way to choose a Take Profit is to check the Parabolic SAR. If the indicator starts changing direction – it’s time to close positions.
Important Remarks
It’s essential to pay attention that the strategy works only in trends. When there is a flat in the market, the strategy may give a lot of false signals.
Trade with FBS using the DeMarker Indicator and Parabolic SAR and get a stable profit.