Take a look at USD/CAD
Read the article on FBS website
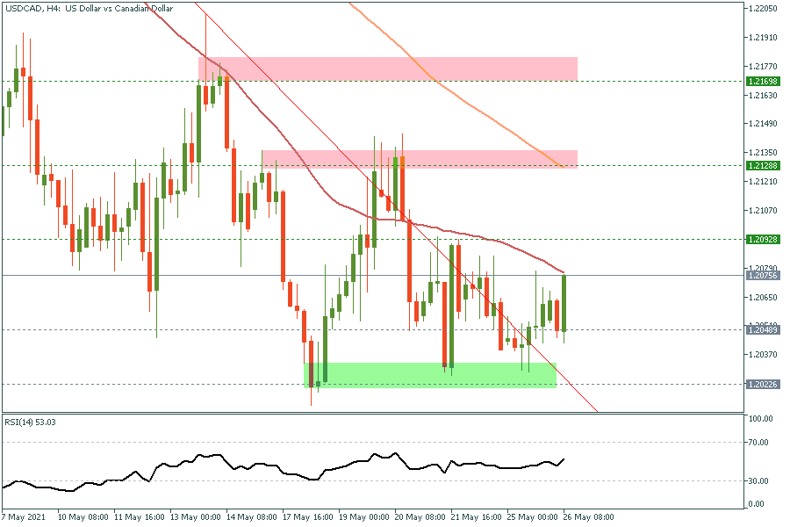
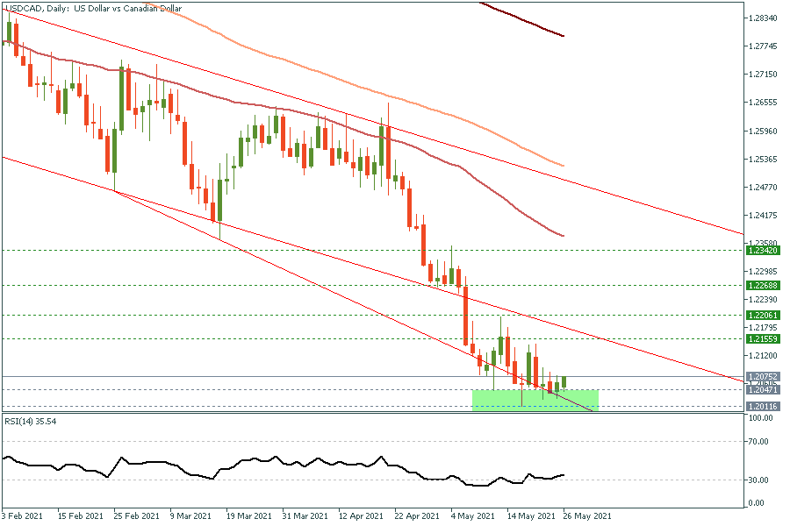
USD/CAD has been trading within a tight range for over two weeks now and holding well above 1.2050’s. The technical indicators are turning higher on the daily chart, which suggests a possible correction to the upside. The area between 1.2060 and 1.20 represents a solid support area which goes back to 2017 when the pair bottomed out and began a long-term bull run that lasted for over two years. Therefore, the current stabilization within the same area would be an opportunity to nibble some longs while the stop loss should not exceed 1.1980. On the upside move, 1.22 could be a reasonable first target in the next few days followed by 1.2235 for now.
| S3 | S2 | S1 | Pivot | R1 | R2 | R3 |
| 1.1960 | 1.2009 | 1.2038 | 1.2058 | 1.2087 | 1.2107 | 1.2156 |