XAUUSD: What To Expect Now.
Following the CPI data release on Tuesday, the price of Gold dropped from its recent high at $2,000 all the way through to the $1980 region where it is currently sitting. As we anticipate what could be next for the yellow metal ahead of the Retails sales data release from the US. In the meantime, here are my projections for XAUUSD going forward.
XAUUSD - D1 Timeframe
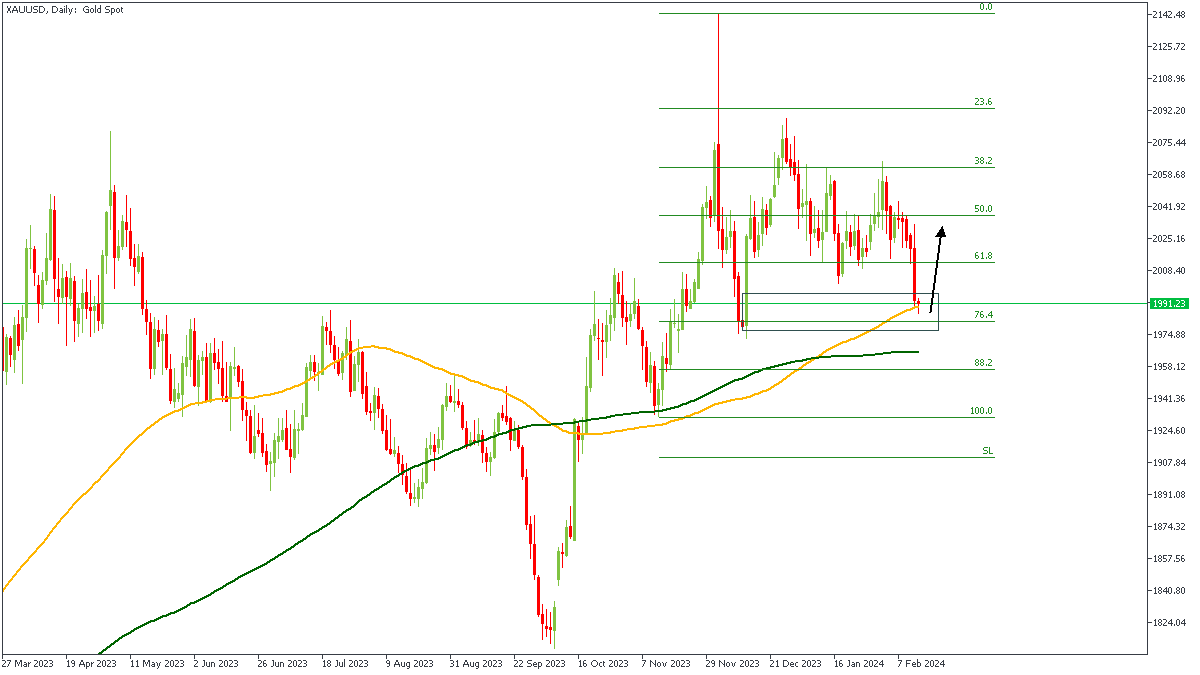
The analysis on XAUUSD that I shared a few weeks ago; in January, I pointed out the bearish movement that has recently played out flawlessly so far, and now the demand zone that was indicated as my target has been reached. In line with this, I expect to see the confluence of the 100-day moving average, the 76% of the Fibonacci retracement, and the bullish array of the moving averages provide the market with renewed bullish vigor.
XAUUSD - H4 Timeframe
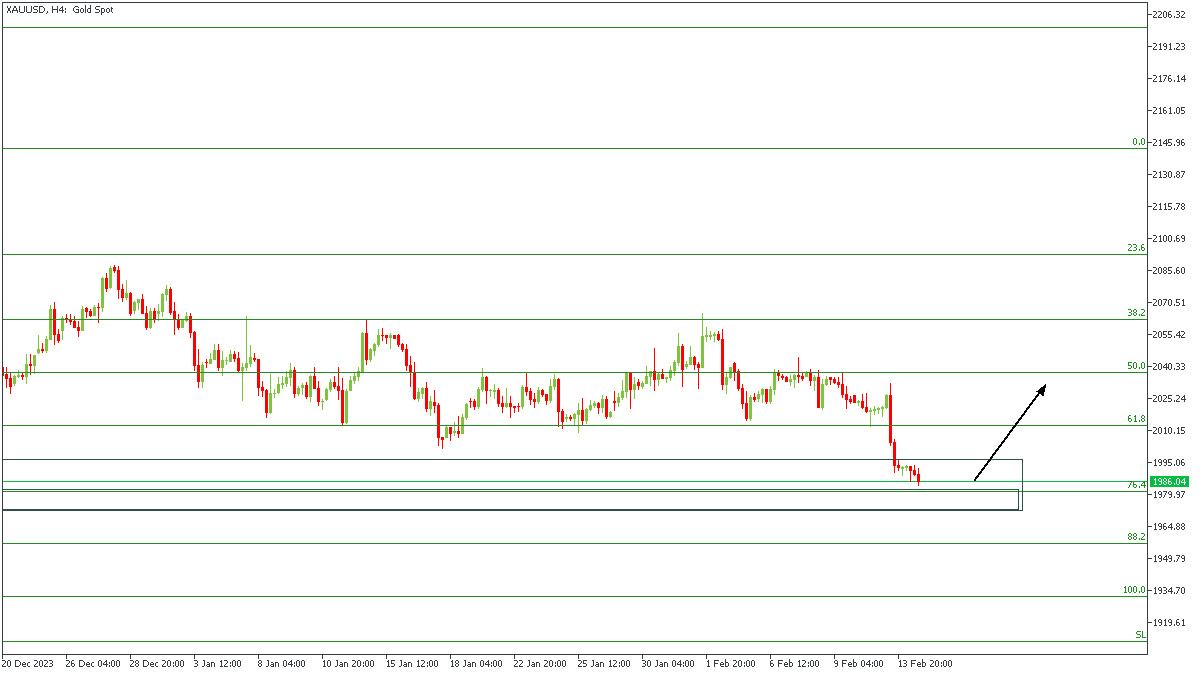
On the 4-hour timeframe of XAUUSD, we can see price currently trading within the demand zone on the 76% Fibonacci retracement level. It is noteworthy that this demand zone sits right within the demand zone on the daily timeframe, and I consider that a good confirmation for incoming bullish pressure.
Analyst’s Expectations:
Direction: Bullish
Target: $2020.95
Invalidation: $1972.22
CONCLUSION
The trading of CFDs comes at a risk. Thus, to succeed, you have to manage risks properly. To avoid costly mistakes while you look to trade these opportunities, be sure to do your due diligence and manage your risk appropriately.
You can access more of such trade ideas and prompt market updates on the telegram channel.