US30 Trading Outlook: Technical Analysis and Market Scenarios.
- Corrective Bearish Scenario: Sells below 38680 with TP1: 38560, TP2: 38500, TP3: 38432 with S.L. above 38820 or at least 1% of account capital*.
- Continuation Bullish Scenario: Buys above 38816 with TP: 39000 with S.L. below 38700 or at least 1% of account capital*. Apply trailing stop.
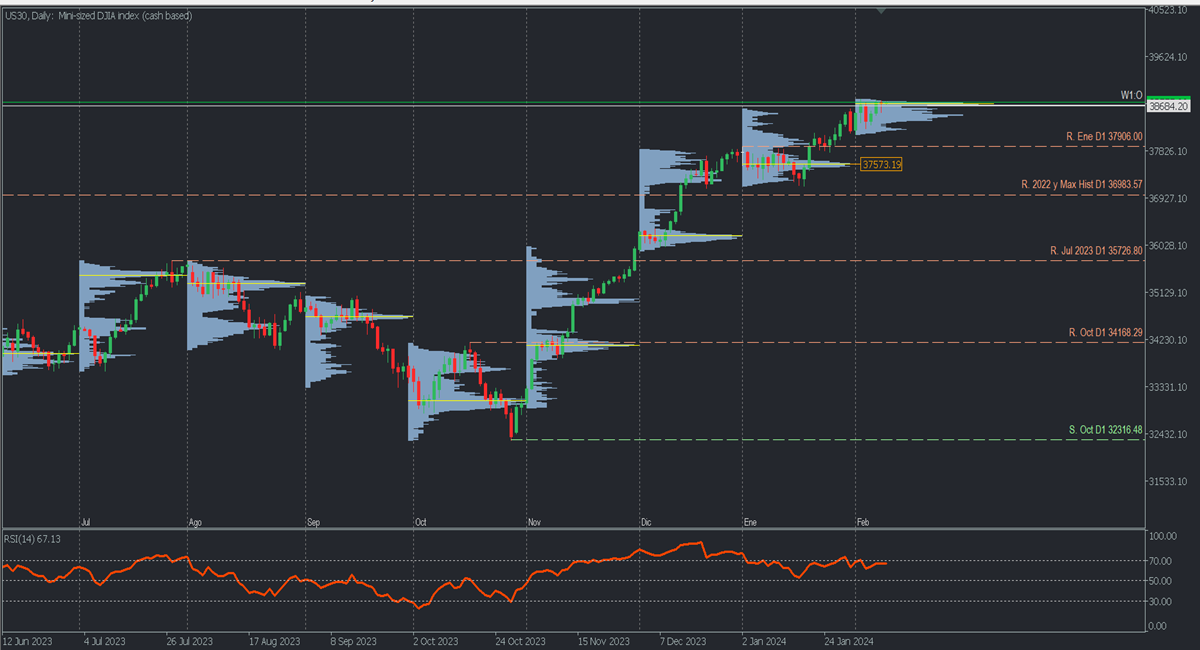
Analysis from Daily Chart
The recent ascent has left the broken January resistance at 37906 as support, the first target of a macro correction, also considering its proximity to January's POC*, which constitutes the last unvalidated buying zone around 37573.19. Both areas are the closest objectives of a price correction in order to resume buys towards 39000 as the nearest round target in the short term.

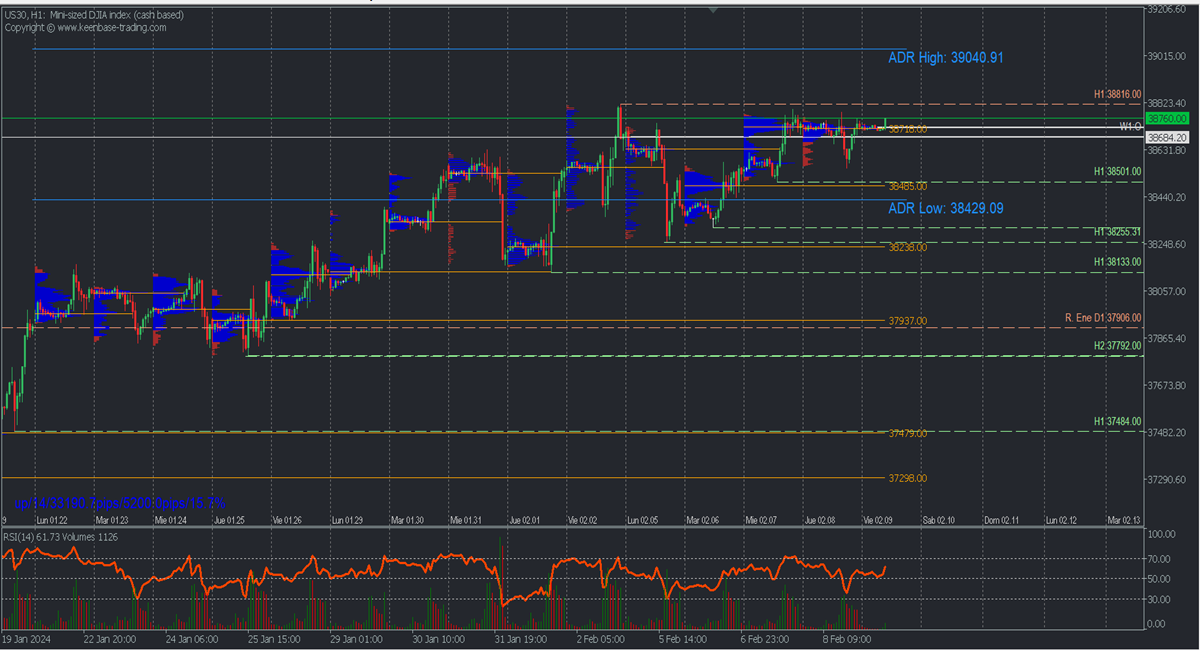
H1 Intraday
The week's rise has left the index consolidated below the 38816 resistance, after decisively breaking Monday's selling zone around 38637. However, this ascent has left several coinciding POCs* on Wednesday, Thursday, and Friday's Asian session around 38720, implying prolonged order accumulation. Thus, a new failure to break the 38816 resistance and the fall below the weekly opening at 38684.20 will encourage bears for a price shift towards Wednesday's support at 38501 and more extendedly the bearish average range at 38431.09.
On the other hand, the decisive breakthrough of the 38816 resistance will continue to expand the price towards new historical highs, considering 39000 as the next round target level. The RSI in positive territory retains bullish momentum, but vertical volume shows a descending trend in bullish movements, suggesting the possibility of a correction.
*Uncovered POC. POC= Point of Control: It is the level or zone where the highest volume concentration occurred. If there was a bearish movement from it, it is considered a selling zone. If there was a bullish impulse, it is considered a buying zone.

**Consider this risk management suggestion
**It is very important that risk management be based on capital and traded volume. For this, a maximum risk of 1% of capital is recommended. It is suggested to use risk management indicators such as the Easy Order.
Disclaimer:
This document does not constitute a recommendation to sell or buy financial products and should not be considered as a solicitation or an offer to participate in a transaction. This document is economic research by the author and is not intended to constitute investment advice, nor solicit securities transactions or any other type of investment by FBS.
Although every investment involves some degree of risk, the risk of loss from trading forex and other leveraged assets can be substantial. Therefore, if you are considering trading in this market, you should be aware of the risks associated with this product to make informed decisions before investing. The material presented here should not be interpreted as advice or trading strategy. All prices stated in this report are for informational purposes only.