Is the Future of Gold Clear Now?
WEEKLY TIMEFRAME - XAUUSD
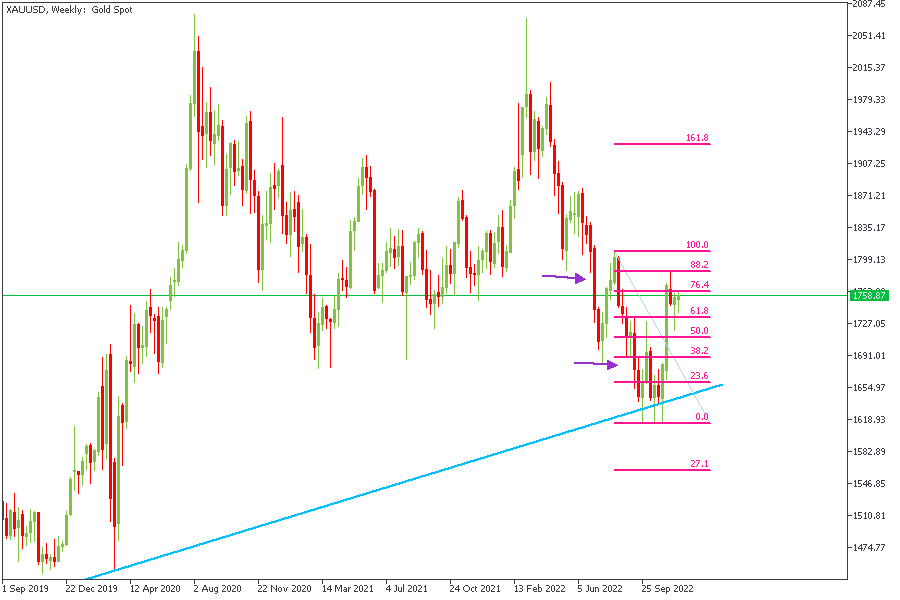
For those who may be unfamiliar with Price Action trading, the horizontal arrows represent areas where the market structure was broken. As you can see in the scenario above, price broke below the previous low at the two marked instances. Considering this from the Weekly timeframe, one can easily identify the market structure as bearish. The Fibonacci tool also indicates that price has been rejected from the 88.2% (which is a relevant level based on my personal trading approach). Let's break it down even further.
DAILY TIMEFRAME - XAUUSD
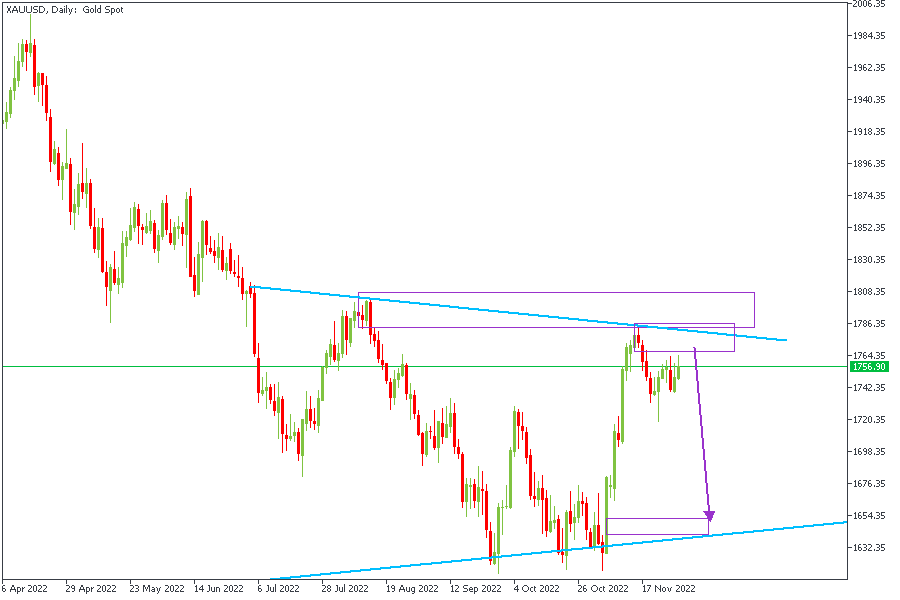
Here on the Daily timeframe, the bias seems a lot clearer. We see the initial reaction happened from a trendline resistance with the help of a rally-base-drop supply zone. Having completed that reaction, we switch to the lower timeframe to validate the possibility of a continuation.
4H TIMEFRAME - XAUUSD
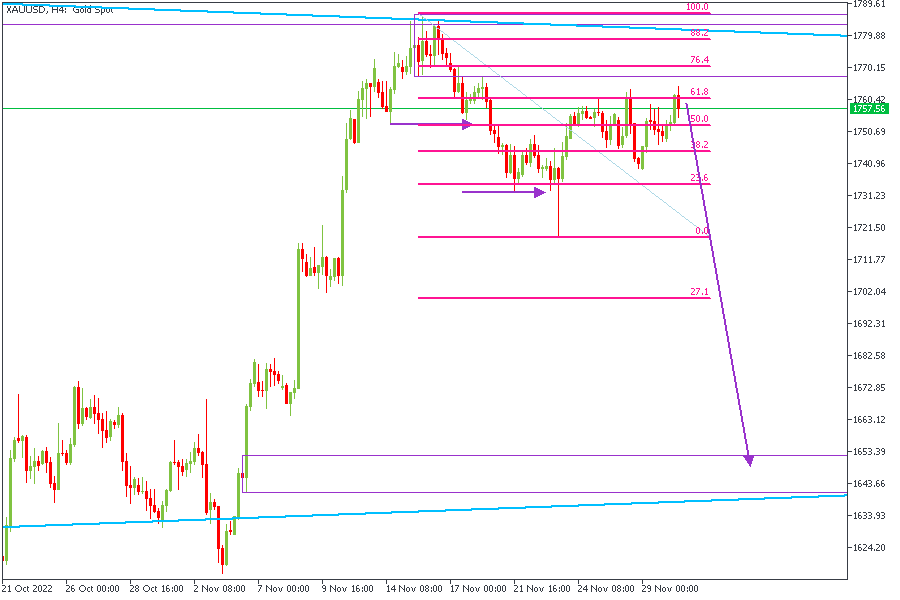
The marked zone between 1770 and 1788 constitutes the preferred point of entry. As you can see, we have confirmed the initial reaction from the Daily supply zone with a break-of-structure on the lower timeframe. The BoS (Break of Structure) also happens to have created a new supply zone. As a result, we can expect price to drop from the area of entry with profit targets at; 1715, 1675, and 1655.
CONCLUSION
It is important to understand that the trading of CFDs comes at risk; if not properly managed, you may lose all of your trading capital. To avoid costly mistakes while you look to trade these opportunities, be sure to do your own due diligence and manage your risk appropriately.
Log into your dashboard or create an account here to get started.