USD Look Bearish Ahead Of The Retail Sales Release
Despite notable fluctuations, the USD is close to its position at the beginning of 2023. HSBC economists are examining the US Dollar's future prospects based on its performance so far. Recent data indicates that a soft landing is the most probable outcome for the US and the global economy. This scenario suggests a shift towards a "risk-on" sentiment, potentially leading to a weaker USD by the end of 2023 and the early part of 2024, which aligns with their primary prediction. However, if the US experiences a challenging economic decline or outperforms other G10 economies, the USD could strengthen, although this would be quite improbable according to the data.
US Dollar - D1 Timeframe
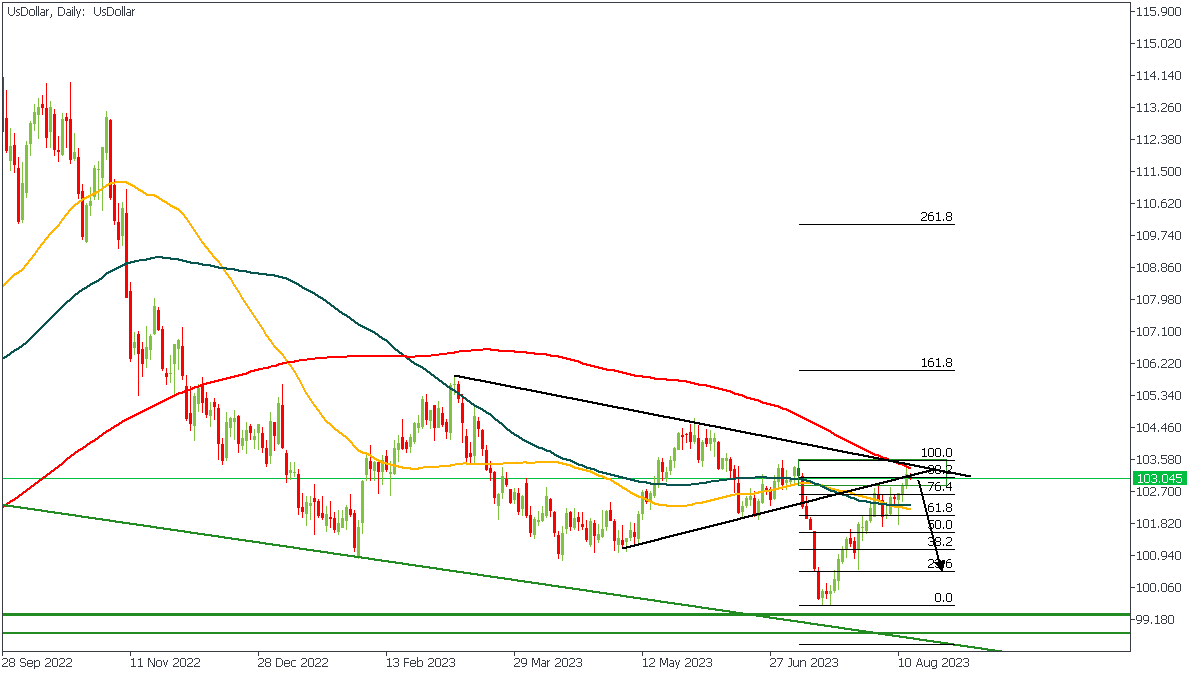
The US Dollar has had quite an interesting few weeks, pushing higher despite an overall downtrend. As seen on the chart, the bullish move has reached a supply zone around the 88% of the Fibonacci retracement zone. Another notable factor here is the confluence of trendlines. See the complete list of confluences below:
- The trendline resistance;
- Bearish moving average array;
- Resistance from the 200-period moving average;
- The 88% of the Fibonacci retracement level.
Analyst’s Expectations:
Direction: Bearish
Target: 100.175
Invalidation: 103.580
EURUSD - D1 Timeframe
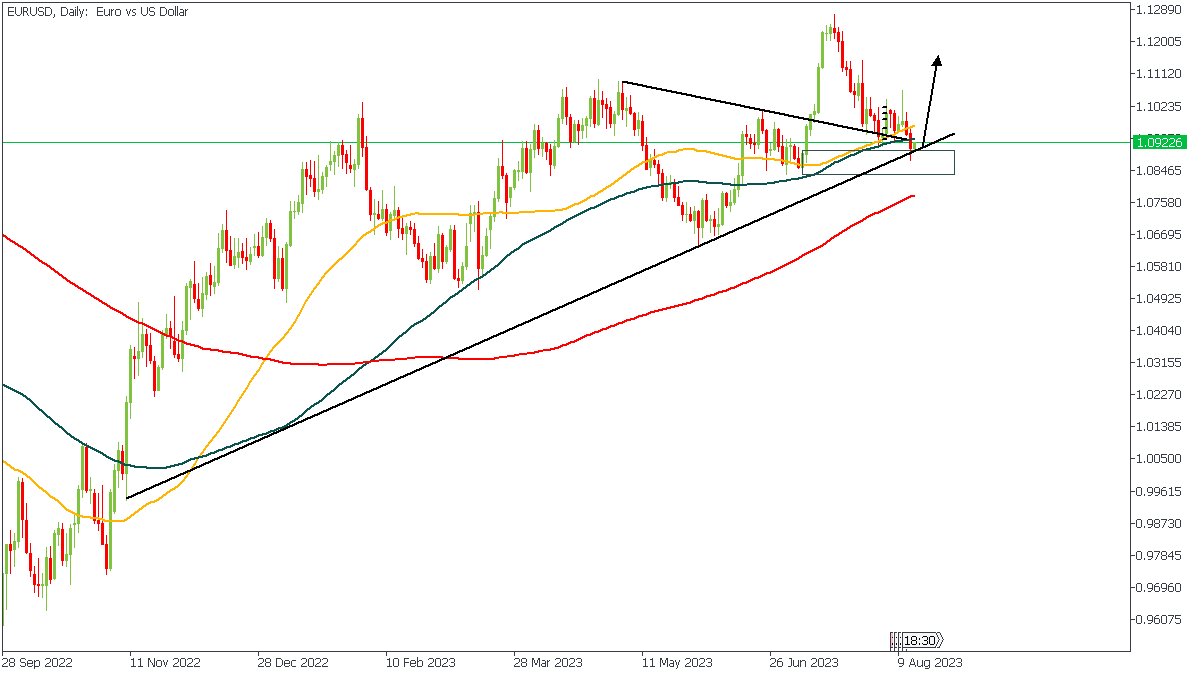
EURUSD has reached a demand zone that overlaps with trendline support and could be well considered within the area of the 50 and 100-period moving averages. The demand zone can also be considered to have occurred within the range of the 88% of the Fibonacci retracement zone. These confluences point towards the likelihood of a bullish impulse.
Analyst’s Expectations:
Direction: Bullish
Target: 1.11655
Invalidation: 1.08350
GBPUSD - D1 Timeframe
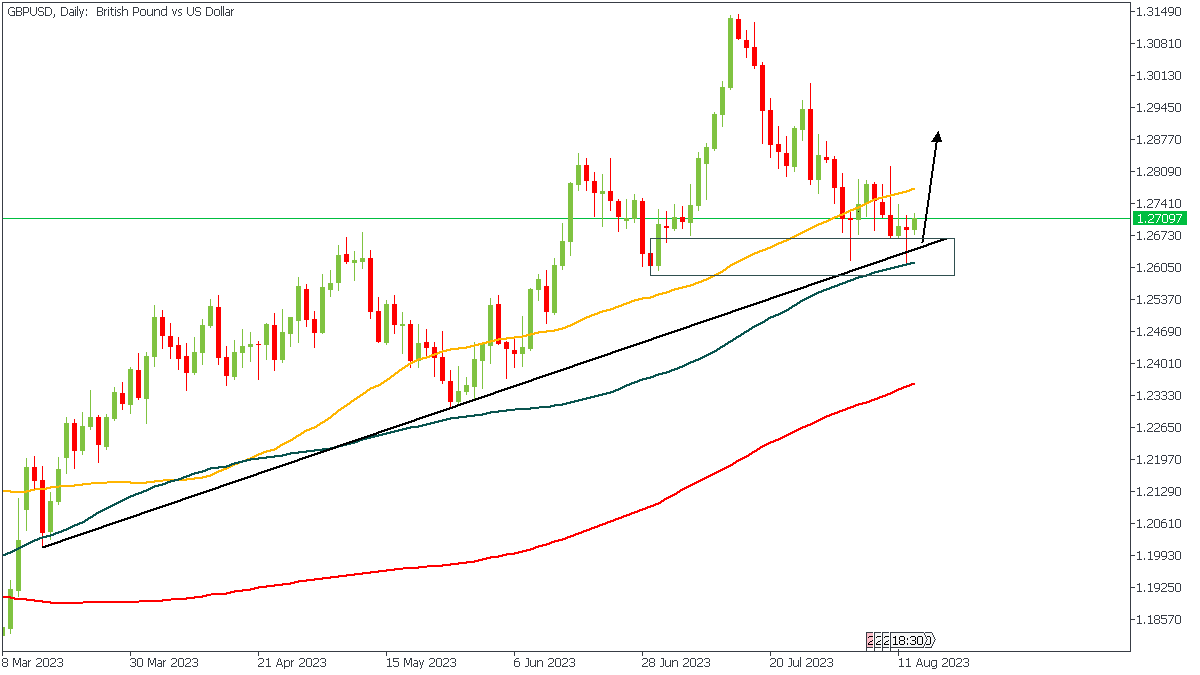
GBPUSD is in a demand zone and reacted initially to the zone, as evident from the wick of the previous daily candle. There is also trendline support cutting across the demand zone, and the 100-day moving average provides additional confluence to the bullish sentiment. The bullish array of the moving averages provides even more reason for the price to commence a bullish run from the highlighted demand area.
Analyst’s Expectations:
Direction: Bullish
Target: 1.28760
Invalidation: 1.25872
CONCLUSION
The trading of CFDs comes at a risk. Thus, to succeed, you have to manage risks properly. To avoid costly mistakes while you look to trade these opportunities, be sure to do your due diligence and manage your risk appropriately.
You can access more of such trade ideas and prompt market updates on the telegram channel.