MXN: historical depths
Key indicators
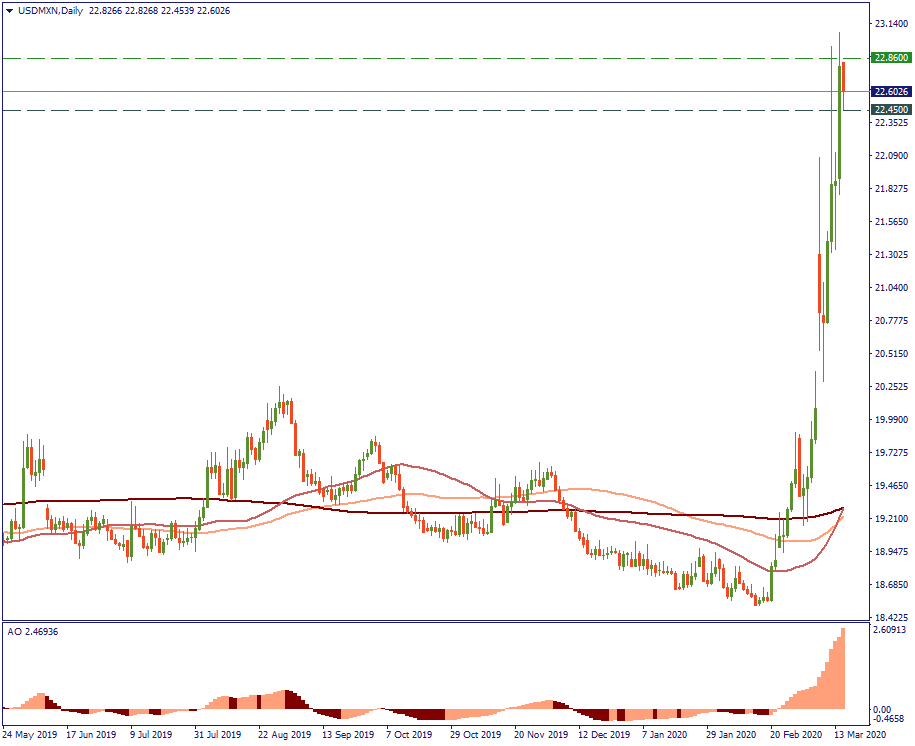
Performance in 2020: +20%
Last day range: 22.45 – 22.83
52-week range: 18.51 – 23.06
What’s happening?
Even if you open a monthly chart, you will not be able to link the current position of the USD/MXN to any point before. Trading at 22.60, this currency pair is at the all-time highs.
As the chart shows, this is a very recent move. It was fueled by the coronavirus-related events and the oil price war. However, it doesn’t mean that the factors pressing on the Mexican peso have just appeared – this currency has been chronically losing its value to the US dollar due to the fundamental weakness of the Mexican economy compared to its northern partner. This weakness has just gained stronger momentum and got propelled to a higher level than before.
Given the current circumstances, there are all the reasons to see the USD/MXN going higher, although a downward correction is to be expected in the short term before the next leap up.
Technical levels
Resistance 22.86
Support 22.45