Hedge funds Sell USD ahead of the FOMC meeting
Recently, gold prices settled by -0.41% at 59309 as the dollar and bond yields rose. However, hopes for a pause in US rate hikes limited the decline after the July meeting of the Federal Reserve. The unexpected drop in new claims for unemployment benefits in the US also contributed to the market sentiment.
Physical gold demand in India stalled due to monsoon rains and higher domestic prices, while in China, bullion was sold at high premiums. Indian dealers offered discounts of up to $6 an ounce over official domestic prices, and in China, gold changed hands at premiums of $9 to $17 an ounce. Swiss gold exports fell 23% in June due to lower shipments to China and India. Let’s take a look at the technical analysis.
US Dollar - D1 Timeframe
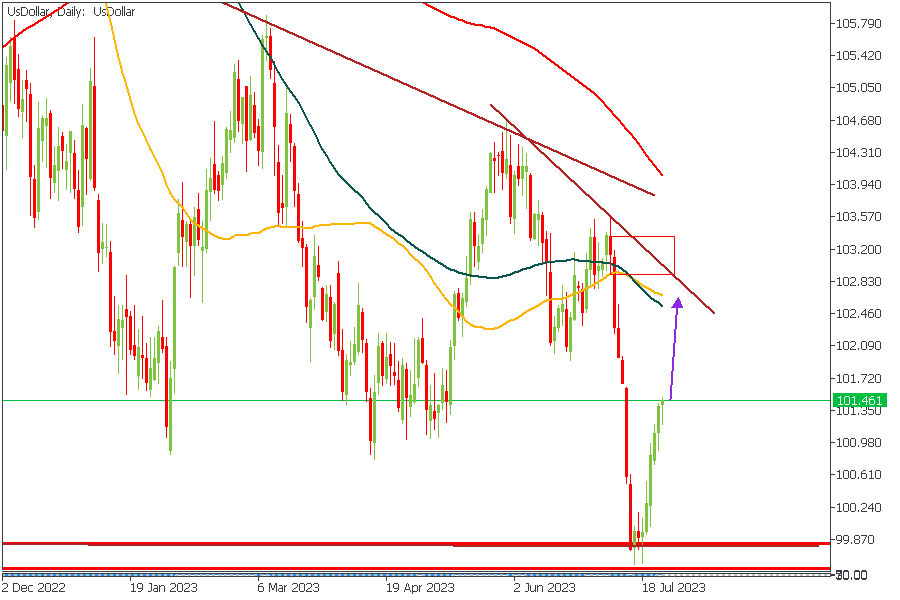
The US Dollar ended the last week with a bullish run all through the week, in a move that seems to be set to continue even further. We see the price sharply pull away from the demand zone on the charts as it heads toward the 50 and 100-period moving averages. The implication is that we are bound to see the bullish move continue until it finds a credible resistance from the moving averages and resistance trendline.
Analyst’s Expectations:
Direction: Bullish
Target: 102.381
Invalidation: 101.174
EURUSD - D1 Timeframe
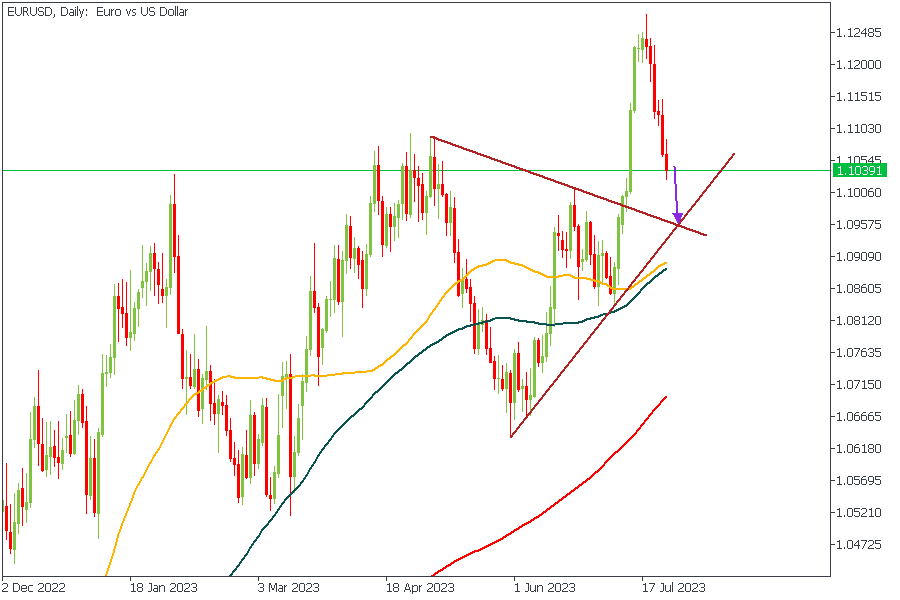
The price action on EURUSD has recently broken out of the wedge and seems to be heading toward the trendline and moving averages in search of support. It is important to note the bullish array of the moving averages to indicate what is most likely to occur once the price reaches the support area. In the meantime, we remain bearish.
Analyst’s Expectations:
Direction: Bearish
Target: 1.09637
Invalidation: 1.10901
GBPUSD - D1 Timeframe
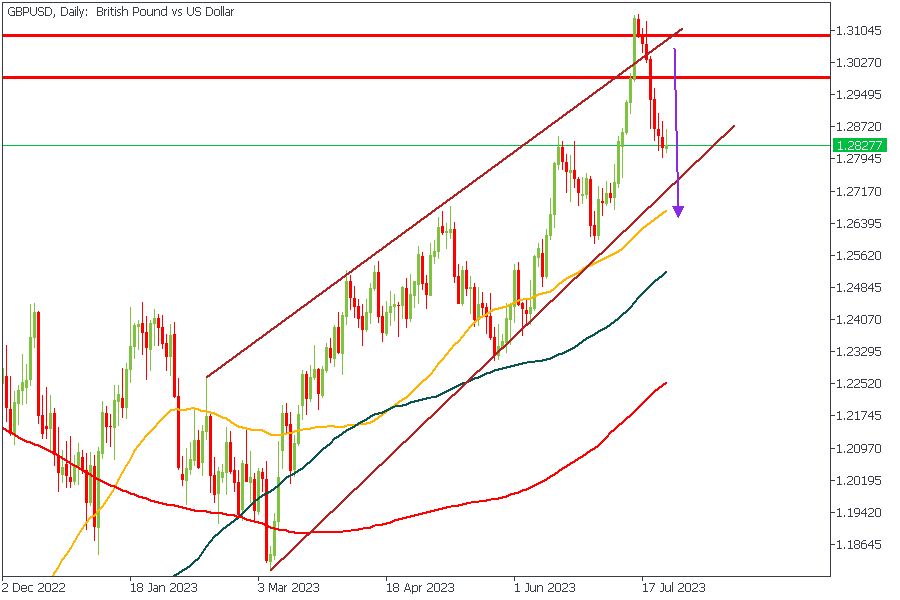
GBPUSD made a huge dump from the pivot supply zone on the daily timeframe. However, the current state of the price action suggests that the price may be heading for the support trendline with a confluence from the 50-period moving average. The trend remains bullish, though, so it would be smart to exercise a sizable degree of risk management on this idea.
Analyst’s Expectations:
Direction: Bearish
Target: 1.27373
Invalidation: 1.28905
CONCLUSION
The trading of CFDs comes at a risk. Thus, to succeed, you have to manage risks properly. To avoid costly mistakes while you look to trade these opportunities, be sure to do your due diligence and manage your risk appropriately.
You can access more of such trade ideas and prompt market updates on the telegram channel.