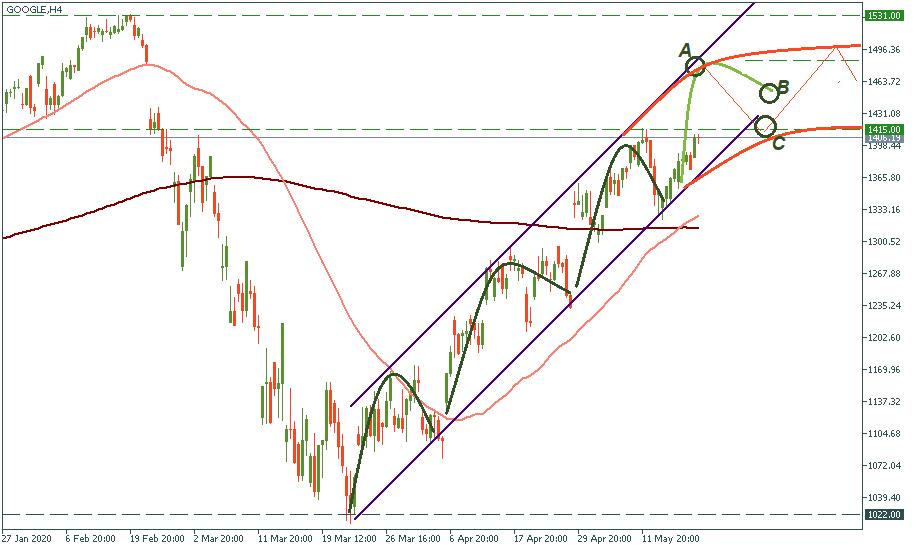
GOOGLE stock: two steps to recovery
On the H4 chart, we see Google stock on the path of recovery. It is almost there, but the question is whether the pace of recovery will remain the same, completing the V-like overall chart formation, or it will slow down coming closer to the resistance of $1,531. Let’s see how we can find that out.
Scenario 1
In the case of steady growth consistent with the trajectory it has been showing after bottoming out in March, the price will make another leap to the higher boundary of the movement channel, which will come to point A roughly corresponding to $1,490. After that, if the inner logic of the movement remains, the price will bounce down to point B – that’s where the lower boundary of the channel will be. This will complete the fourth wave of the upward movement.
Scenario 2
Otherwise, the stock will slow down the closer it gets to the full recovery mark of $1,531. In the weakening growth scenario, the stock may come to point A or slip lower to eventually get into a bearish move crossing the lower border of the initial movement channel. That’s how point C may be reached, bending the overall trajectory range closer to the horizon. After that, the stock will anyway rise again, but probably to $1,496 or even below.
Which scenario will it be? Make your bets, we will discover soon enough.