EUR/USD: "V-Bottom" pattern
Read the article on FBS website
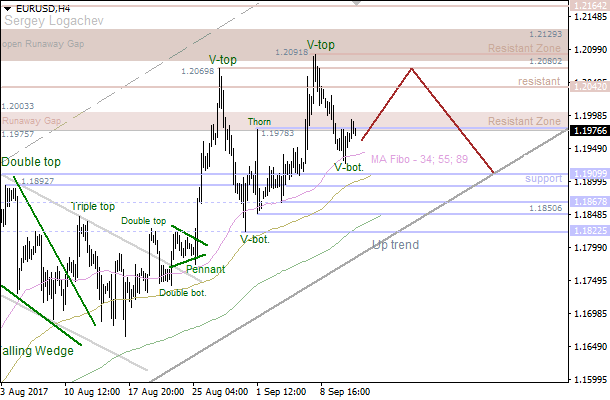
The main trend is still bullish. The 34 Moving Average has acted as support, so we've got a "V-Bottom" pattern on this line. Therefore, the market is likely going to reach the nearest resistance at 1.2042 - 1.2069 in the short term. If a pullback from this area happens, we could have a decline towards the next support at 1.1909.
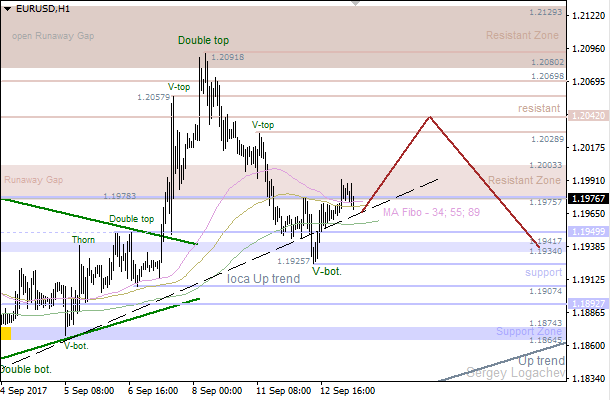
Bears faced with support at 1.1907, so we've got a "V-Bottom" pattern, which led to the current consolidation. In this case, the pair is likely going to achieve the closest resistance at 1.2028 - 1.2042 during the day. Meanwhile, if we have a pullback from these levels, there'll be an opportunity to have a downward price movement towards another support at 1.1941 - 1.1934.