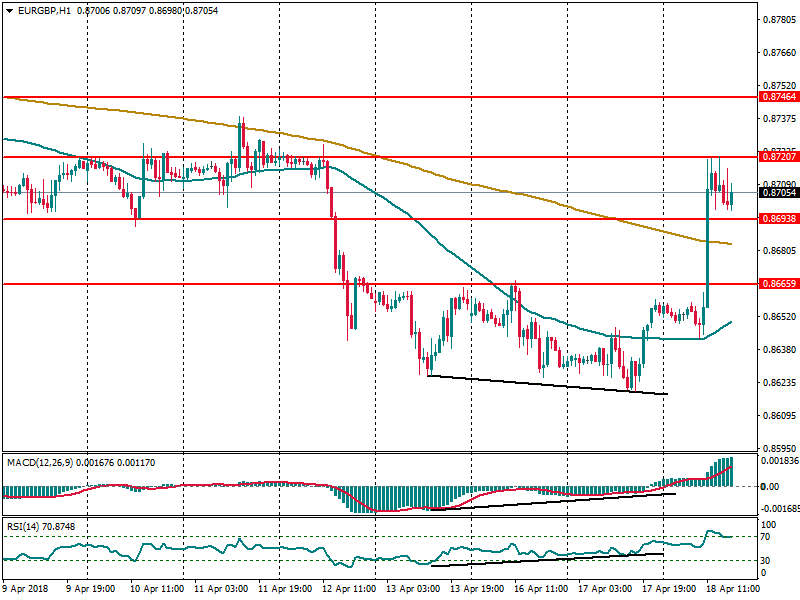
EUR/GBP with a bullish divergence at MACD and RSI indicators
Read the article on FBS website
EUR/GBP has been showing interesting patterns’ formations at the H1 chart, with a bullish divergence that appeared in the MACD and RSI indicators, which could be a sign of a strong bottom found around 0.8600. That’s why we’ve saw a strong rally above the 200 SMA and currently, the pair is looking to break above the resistance level of 0.8720. If that happens, then the next target would be the 0.8746 zone. To the downside, a consolidation below 0.8693 should expose the 0.8665 level.
RSI indicator remains in the overbought territory, calling for a pullback in the short-term.